Impelix came to us to boost lead generation for their new AI-driven cybersecurity product, IMPACT. With a crowded market and risk-averse decision-makers, their sales team struggled to generate qualified leads through conferences and networking. We created several TAMs and deployed LinkedIn conversation ads with tailored messaging for different industries and seniority levels. The messaging was refined to highlight IMPACT’s unique value proposition. Results: 48 MQLs in Q4 with a CPMQL of $445.66, surpassing industry benchmarks. Adjustments to qualifying questions led to improved lead quality, a 8% click-to-open rate, and a 84.2% form completion rate.
Success Stories
15% increase in ad spend, 111% increase in LinkedIn visits
TigerConnect, a cloud-based clinical communication platform, faced challenges with low-volume search terms like "HIPAA texting" and struggled to generate qualified leads. To address this, we expanded their marketing strategy to LinkedIn and implemented account-based marketing (ABM), targeting specific job titles and healthcare roles like patient care and nursing. Testing content assets, we found that an eBook on communication challenges in clinical settings drove the most conversions. As a result, we saw a 31% increase in paid leads and a 111% rise in website visits from LinkedIn, all with only a 15% increase in ad spend.
Success Stories
100% MQL increase, 1 in 3 become customers
Giftbit approached us to enhance the performance of their LinkedIn campaigns. We tested a shift from a single-image ad with broad messaging to a conversation ad featuring a holiday-themed offer. Over a 15-day period, the incentive-driven campaign resulted in a 100% increase in MQLs, directly attributable to the targeted, ICP-specific holiday messaging. Of these, 33% advanced into sales opportunities. This success has set the stage for ongoing message testing and further optimization of Giftbit’s advertising strategy.
B2B Meta Benchmarks for Facebook Advertising Services
B2B Meta Benchmarks for Facebook Advertising Services
B2B CMOs, demand gen leaders, and paid social managers are stuck with a familiar problem: most “Facebook benchmarks” are built on e-commerce and local services, then misapplied to long-cycle B2B funnels. This guide translates external Meta benchmarks* into practical CTR, CPM, CPC, and CPL ranges by B2B vertical, and shows how to use them to set goals, plan spend, and defend budgets for Facebook advertising services.
How to use Meta benchmarks to plan B2B Facebook advertising services
Benchmarks are inputs to a planning system, not report-card grades. Their job is to keep your targets sane, give finance a defensible “why,” and help you decide whether you need new creative, better audiences, or just more time at stable spend.
The high-level flow is simple: (1) choose the right benchmark set (vertical + funnel stage), (2) translate CTR/CPM into forecasted volume, and (3) translate CPL into budget and pipeline scenarios. Then you use tests to move performance toward the healthy range without violating your LTV:CAC constraints.
One guardrail: prioritize business metrics (pipeline, revenue, CAC, LTV:CAC) over surface-level metrics (CTR alone). CTR can be “good” while pipeline is terrible if you are buying cheap curiosity clicks that do not match your ICP.
Star notation note (define early): All starred ranges in this article are based on external benchmark studies* and should be treated as directional, not guarantees. Always validate in your own Ads Manager, in your market, with your offer and tracking.
Fast-start 5-step process for using benchmarks
Pick your primary outcome (pipeline, demo requests, trials). Why this matters (finance lens): you cannot defend spend if the “win condition” is not tied to revenue outcomes and payback expectations.
Select the closest-matching industry vertical from benchmark sources*. Why this matters: different verticals price impressions differently, which changes how much budget you need to buy enough signal for decisions.
Choose the right objective and funnel stage (awareness vs lead gen vs retargeting). Why this matters: “good” CTR and CPM are not universal. Finance wants predictable volume by stage, not one blended number.
Pull current CTR, CPM, CPC, and CPL from Ads Manager and compare to benchmark ranges*. Why this matters: this is your gap analysis. It tells you whether efficiency problems are likely upstream (cost to reach) or downstream (conversion quality).
Decide whether to change goals, creative, audiences, or budget based on gaps. Why this matters: every change has an opportunity cost. Benchmarks help you justify reallocation and set expectations for variability.
What makes B2B Meta benchmarks different from generic social ads
B2B teams cannot copy generic Facebook benchmarks built on ecommerce and local retail. Your TAM is smaller, your buying journey is multi-touch, and the stakes per qualified lead are higher. In B2B, “more leads” is not a win if sales says they are junk.
This is why broad all-industry numbers* can mislead. For example, WordStream reports overall averages around ~1.57% CTR and ~$0.77 CPC for Traffic campaigns* and ~2.53% CTR, ~$1.88 CPC, and ~$21.98 CPL for Leads campaigns*, across industries (WordStream*). Those can be useful sanity checks, but they do not describe your specific B2B constraints.
B2B-specific datasets often show lower CTR baselines for prospecting and meaningfully higher effective CPLs once you factor in qualification and pipeline progression. Refine Labs, for instance, reports Facebook CPM around $4.00 and CTR around 0.60%* for B2B SaaS benchmarks (Refine Labs*). Dreamdata also frames Meta as a “modest share” channel for many B2B advertisers, not necessarily the primary last-click revenue engine (Dreamdata*).
Abe’s POV: B2B paid social (including Meta) becomes a revenue engine when you pair first-party data, TAM verification, and creative that sells a clear business outcome. Not “brand awareness.” Not “engagement.” A business result.
The tables below are intentionally compact. The goal is not to hand you a single “good number.” The goal is to give you a working range* you can use to forecast volume, plan tests, and explain tradeoffs to finance and sales.
Source notes (examples, not exhaustive): Refine Labs reports B2B SaaS Facebook CPM (~$4.00) and CTR (~0.60%)* (Refine Labs*). WordStream reports overall cross-industry averages for Traffic (CTR ~1.57%, CPC ~$0.77)* and Leads (CTR ~2.53%, CPC ~$1.88, CPL ~$21.98)* (WordStream*). Junto reports B2B services CPM commonly ~€8–€15 and CPC ~€0.30–€1.00* (Junto*).
Reminder: verify any quoted costs or ranges against the most recent benchmark sources before publishing, as Meta pricing changes frequently.
How to read the table: treat the “middle of the range” as a sanity check, not a goal. Your first target is usually “get into the healthy band consistently.” Top-quartile performance is a stretch goal, and it is often unlocked by better audience inputs (first-party), stronger offers, and creative that says something real.
Also, remember that B2B CPLs can be 10–50x click costs* depending on conversion rates and qualification criteria. Dreamdata’s benchmarks show Meta can be efficient for volume and influence, even if last-click ROAS looks weak (Dreamdata*). In other words: do not judge Meta like you judge Search.
B2B Meta benchmarks* by vertical
Verticals are where benchmarks become useful. Below are directional ranges* stitched from the external sources in this brief (Marketing Advisor for CTR/CPC/CPM by industry*, plus B2B-specific sources for SaaS and CPL context*).
Vertical table source notes: Business Services, Industrial & Commercial, and Education CTR/CPC/CPM from Marketing Advisor’s Meta Ads Benchmark Report (2024)* (Marketing Advisor*). Finance example lead CPC and CPL from WordStream’s Facebook Ads Benchmarks 2024* (WordStream*). Industrial example CPL aligns with Marketing Advisor CPA figure shown for that industry* (Marketing Advisor*). B2B SaaS CPM and CTR baselines from Refine Labs* and supplemental B2B SaaS CPM/CPC benchmarks from Varos* (Refine Labs*, Varos*). SaaS & Cloud CPL benchmark context from Superads* (Superads*).
How audience maturity shifts your place in the range
The same vertical can look “bad” or “great” depending on audience maturity and list quality. Use three simple states:
Cold: Broad or lightly qualified audiences (interests, lookalikes, wide geos).
Warm: Engaged viewers, site visitors, content engagers.
As you move from cold to hot, CPM often rises and CTR often improves* because you are bidding on smaller, more competitive audiences (and the algorithm has clearer signals). CPL can still be higher in hot segments because the offers are typically higher intent and higher value (demo, pricing, “talk to sales”), and you are intentionally filtering out low-fit conversions.
This is also where Abe’s Customer Generation™ angle matters: if your TAM is verified and your first-party audiences are clean, your benchmark comparison stops being “random traffic vs random traffic” and becomes “our buying committee vs the market’s buying committee.” That is the version finance can actually trust.
How creative & offer move your metrics
Creative is the lever that can move you from “in-range” to “top quartile.” It is also the lever that most B2B teams underinvest in because it feels subjective. It is not. The feed is a pricing market for attention. Your creative sets the price you pay.
Demand creation creative (educational, story-led, problem agitation) is built to earn engagement and train the algorithm. Over time, it can improve CTR and stabilize CPMs* because Meta learns who actually engages with your message.
Direct-response lead gen creative (ROI calculators, benchmark reports, live workshops) can have weaker CTR but stronger conversion rates. It may drive higher CPLs, yet produce better-qualified leads that convert into opportunities.
Two B2B examples that commonly beat generic ebook ads:
“SaaS benchmark report” ads that call out one uncomfortable datapoint and promise a specific takeaway (a planning range, a model, a peer comparison).
Testimonial-style video ads where the customer leads with the business outcome (pipeline created, payback period, sales cycle impact), not a feature tour.
Abe’s bias is simple: creative should make a concrete business promise (pipeline, cost savings, payback period). Vague “brand” language does not earn clicks or trust, and it rarely improves downstream efficiency.
Steps Playbook: Turn benchmarks into goals & budgets
This playbook is designed to drop into a planning doc. Each step includes what to do, why it matters, and pitfalls to avoid.
Step 1 – Define business constraints. What to do: Start with CLTV, gross margin, and target LTV:CAC (for example, 3:1). Use those to bound maximum sustainable CAC, then back into a maximum sustainable CPL based on your funnel conversion rates. Why it matters: It prevents “benchmark chasing” that looks efficient on-platform but breaks unit economics. Pitfalls: (1) Using blended CLTV when product lines have different paybacks. (2) Treating every lead as equal when sales only accepts a fraction.
Step 2 – Choose the right benchmark set for your vertical & funnel. What to do: Pick the closest industry, geography, and objective from sources like WordStream, Marketing Advisor, and Refine Labs*. Do not mix 2019 benchmarks with 2025 auctions. Why it matters: Finance conversations go better when you can cite a peer set and a date range. Pitfalls: (1) Comparing lead-gen campaigns to traffic benchmarks. (2) Using global benchmarks for a single-country plan without adjustment.
Step 3 – Set sane target ranges, not single numbers. What to do: Translate external medians and top-quartile benchmarks* into a “good band” per metric. A practical default is: aim to be within about ±20–30% of a relevant median to start, then pursue stretch performance once tracking and creative are stable. Why it matters: Single-number targets create false precision and bad decisions when results naturally fluctuate. Pitfalls: (1) Penalizing teams for normal weekly volatility. (2) Over-optimizing to CTR and harming lead quality.
Step 4 – Convert CTR/CPM into volume, and CPL into budget. What to do: Model impressions and clicks from CPM and CTR, then leads from your click-to-lead rate, then pipeline from lead-to-opportunity and win rate. Use benchmark ranges* to create best-case and worst-case spend scenarios. Why it matters: This is how you turn “Meta performance” into a budget request that finance can evaluate. Pitfalls: (1) Using last-click only to value Meta. (2) Ignoring that small audiences cap impression volume. Simple illustrative example (not a promise):
Step 5 – Design your first 30–60 day test plan. What to do: Choose 2–3 high-impact tests that can realistically move you from the low end of the range toward median. Prioritize: (1) offer clarity, (2) creative hooks and formats, (3) first-party audience quality (CRM lists, engaged-view retargeting). Why it matters: Fragmented testing is expensive. You want learning with statistical weight, not 12 tiny experiments that all fail the learning phase. Pitfalls: (1) Over-segmentation that spikes CPM without increasing pipeline. (2) Testing five variables at once.
Step 6 – Align expectations with sales and finance. What to do: Present benchmarks as ranges with explicit tradeoffs: “At this CPM and CTR*, here is the volume we can deliver at our budget, and here is the range of CPL outcomes we should plan for.” Then agree on what happens if you land below, in, or above the band. Why it matters: Budget defense is easier when you pre-negotiate what “success” looks like and what actions follow. Pitfalls: (1) Reporting only Meta platform metrics without CRM outcomes. (2) Letting sales define quality after the leads arrive.
Step 7 – Lock in a review cadence and reset benchmarks. What to do: Recheck benchmark inputs quarterly (at minimum), and rebase internal targets using rolling 60–90 day performance once tracking is stable. Why it matters: Auctions shift with seasonality, competitors, and creative fatigue. A static benchmark becomes wrong fast. Pitfalls: (1) Changing targets monthly (noise). (2) Never changing targets (delusion).
How to measure and report Meta performance against benchmarks
Your measurement philosophy should be boring: Meta metrics (CTR, CPM, CPC) are leading indicators. The scorecard is opportunities, pipeline, and revenue. Benchmarks help you interpret the leading indicators so you can fix problems before the quarter is over.
A practical dashboard approach: for each funnel stage, show (1) your actual metric, (2) the benchmark range*, and (3) a status label (below, in-range, stretch). Then layer CRM outcomes (MQL, SQL, opportunities) on top, so performance discussions do not end at clicks.
Metrics that matter at awareness and engagement
At awareness, you are buying reach against your ICP and training the algorithm. Track reach, frequency, CTR, CPC, video view rate, and engaged-view metrics. Use benchmarks* to decide whether low performance is likely a creative problem (weak hook), audience problem (too broad or irrelevant), or budget problem (not enough scale to stabilize).
Deprioritize vanity metrics like page likes and post reactions unless you can prove they correlate with downstream CRM outcomes. Finance will not fund vibes.
Metrics that matter at lead-gen and pipeline
Lead-gen only matters if leads turn into pipeline. Track Meta leads through MQL, SQL, opportunity, and closed-won. Many B2B teams see single-digit click-to-lead rates and low-double-digit lead-to-opportunity rates*, but treat those as directional until you validate in your own CRM.
A useful normalization metric is pipeline per 1,000 impressions:
Pipeline per 1,000 impressions = (Pipeline $ attributed or influenced) / (Impressions / 1,000)
Then compare across advertising platforms (Meta vs LinkedIn vs YouTube) using the same time window and attribution rules.
CAC, LTV:CAC, and payback are the metrics that decide whether Meta is “worth it.” Meta benchmarks* are inputs, not conclusions. Your job is to translate a change in CPL into a change in CAC and payback.
Takeaway: a “small” CPL increase can meaningfully change CAC. This is why benchmark ranges are useful. They help you spot when you are drifting into a band that breaks unit economics.
How Meta benchmarks connect to your stack
Benchmarks are only as good as the tracking and data hygiene underneath. If your UTMs are inconsistent, your CRM lifecycle stages are messy, or your offline conversions are missing, you will argue about CPL forever and still not know if Meta is creating revenue.
At minimum, ensure you pass UTMs, campaign IDs, and conversion events correctly so Meta benchmarks tie to real revenue. If you are serious about Meta as a B2B channel, plan for first-party data flows and offline conversion imports, not just pixels.
Workflow example with HubSpot or Salesforce
Here is a clean, practical workflow that makes benchmarking real:
Meta Ad drives to a lead form or landing page (with UTMs and campaign parameters).
Marketing automation (HubSpot or Marketo) captures the lead, enriches it, and applies lifecycle stages.
CRM (Salesforce or HubSpot CRM) receives the lead and tracks SQL and opportunity creation.
Closed-won revenue is mapped back to campaign and audience inputs.
Offline conversion imports feed back to Meta so optimization learns from qualified outcomes, not just form fills.
Where benchmarks belong: store CTR/CPM/CPC by campaign and audience in your reporting layer weekly, store CPL by offer monthly, and store pipeline per 1,000 impressions quarterly once opportunity data matures.
Governance and ownership
If everyone owns benchmarks, no one owns benchmarks. This is a simple responsibility split that works in real B2B orgs:
Testing roadmap and optimization playbook
Once you see where you land versus benchmarks*, the move is prioritization. Fix tracking and audience fundamentals before you obsess over small CTR lifts. Then run a steady testing rhythm (often 2–3 meaningful tests per month) across creative, audience, and offer, without fragmenting spend into dust.
If your programs are not performing at all
This usually looks like being far below low-end benchmarks* on CTR and far above them on CPL, with little or no qualified pipeline.
Wrong ICP or geography: you are paying to reach the wrong people efficiently.
Broken tracking: conversion events, UTMs, or CRM mapping are incorrect, so optimization is blind.
Offer mismatch: asking for demos from cold audiences with no proof or value exchange.
Audience too small or too fragmented: learning never stabilizes.
Budget too small for signal: you cannot draw conclusions, especially about CPL or pipeline.
Start with TAM verification, first-party audience building (site retargeting, CRM lists), and an offer with a clear business outcome. Then evaluate budget. A small test budget can be directional for CTR/CPM, but rarely enough for statistically strong CPL or pipeline insight (Hootsuite*).
If your programs are underperforming
This is the more common scenario: you are within striking distance of vertical medians* but not yet efficient. Here, lighter-weight tests usually win:
Creative: rotate hooks, swap formats (static vs short video), and tighten the “promise” in the first line.
Bidding: test lead objective variants (web vs instant forms) and optimize for higher-quality events when possible.
Segmentation: separate decision-maker and practitioner audiences so messaging matches intent.
Measure uplift relative to benchmarks, not just absolute change. Example framing: “We moved from bottom-quartile CTR* to median in four weeks by refreshing creative and tightening the offer.”
How to interpret your test results
High CTR, poor CPL: clicky creative that does not match the offer or landing page. Next test: align promise to page, tighten qualification, or change offer.
Benchmark-level CTR, high CPL: likely a conversion problem (landing page, form friction, weak proof). Next test: faster page, stronger proof, shorter form, different CTA.
Strong CPL, weak pipeline: lead quality or routing. Next test: add qualification, enforce ICP fields, tighten geo/company filters, improve speed-to-lead.
Low CTR, strong CPL: fewer clicks but high intent. Next test: scale cautiously, broaden slightly, or build a demand layer to increase volume without killing quality.
Great on-platform metrics, no CRM signal: tracking and attribution are the problem until proven otherwise. Next test: offline conversions and lifecycle stage QA.
Benchmarks are context, not a substitute for your own data. Use them to pick the next experiment, not to declare a verdict.
Expert tips and real world lessons
Layer demand creation before lead capture. A steady stream of educational creative often improves CPL relative to benchmarks* because retargeting pools get smarter.
Stop over-segmenting early. Over-segmentation can push CPM above top-end benchmarks* without improving pipeline.
Broad targeting plus strong exclusions can beat “interest salad.” For B2B, narrow interest stacks often feel precise and perform average.
Build offers that earn information. “Get a demo” is not an offer. A benchmark report, calculator, or workshop is.
Do not celebrate cheap leads until sales agrees. If sales rejects them, your CPL is fiction.
Optimize to quality events when possible. If you can pass back MQL or SQL, do it. Pixels alone tend to reward volume, not value.
Keep creative briefs tied to business outcomes. “Save 10 hours a week” beats “all-in-one platform” almost every time.
Watch frequency like a hawk in warm/hot audiences. If frequency climbs and CTR falls, you are paying a “fatigue tax.”
Use benchmarks to argue for time, not just budget. Meta needs learning cycles; panicked weekly strategy changes create noise.
Benchmark in the same measurement model every time. If you change attribution rules mid-quarter, you are benchmarking chaos.
FAQ: B2B Meta benchmarks & Facebook advertising services
What are Meta benchmarks and why should B2B teams care?
Meta benchmarks are reference ranges from aggregated performance datasets that help you sanity-check CTR, CPM, CPC, and CPL. B2B teams should care because benchmarks help set realistic targets, model spend, and communicate tradeoffs to sales and finance without guessing.
What is a “good” CTR, CPM, CPC, and CPL for B2B Facebook advertising services?
There is no single “good” number. Use vertical and funnel-stage ranges*, then validate them in your market and against your unit economics. Treat benchmarks as directional guardrails, not guarantees (WordStream*, Marketing Advisor*, Refine Labs*, Junto*).
How often should we refresh our Meta benchmarks?
Recheck external benchmarks at least quarterly, and rebase internal targets using your rolling 60–90 day performance once tracking is stable. Meta auctions shift with seasonality and competitive pressure, so stale benchmarks cause bad budget decisions.
How long does it take to move from below-benchmark to median performance?
If tracking and conversion paths are healthy, meaningful movement often comes from a 30–60 day cycle of focused creative and offer testing. If fundamentals are broken (tracking, ICP, routing), it can take longer because you are rebuilding the measurement system first.
How much budget do we need to make benchmarks meaningful?
You need enough spend to exit the “noise zone,” where results swing wildly week to week. Smaller budgets can still be useful for directional CTR/CPM learning, but you should be cautious about declaring victory or failure on CPL and pipeline too early (Hootsuite*).
Move beyond generic Meta benchmarks with Abe
Generic benchmarks are fine for internet arguments. They are not fine for budget decisions. Abe treats Meta like a disciplined revenue channel, using the same Customer Generation™ methodology, first-party data discipline, and financial modeling we apply across B2B paid social.
We build verified TAM and CRM-based audiences, so you stop paying for impressions outside your buying committee and your benchmark comparisons are actually apples-to-apples.
And yes, we bring the safety rails: Abe has a track record managing $120M+ in annual ad spend and delivering an average 45% reduction in cost per lead. That matters when you are trying to scale Meta without lighting budget on fire.
If you want to stop guessing whether your Meta results are “good” and start treating Facebook as a revenue channel you can defend to finance, the next step is straightforward: See our Facebook advertising services.
For B2B leaders scaling advertising on YouTube, the fear is rational: one bad adjacency can undo years of trust, trigger executive backlash, and stall future investment in the channel. The goal is not paranoia. It’s repeatable controls. This guide walks through how a disciplined YouTube advertising agency approaches YouTube brand safety, YouTube placement controls, and YouTube content exclusions so you can scale without putting your brand or pipeline at risk.
How to set up brand safety and placement controls on YouTube
Here’s a practical roadmap you can follow from “we should try YouTube” to “this is a scalable channel” without playing placement roulette:
Step 1: Define brand risk tolerance and non-negotiables. Document what “unsafe” means for your company (legal, comms, HR, exec team), plus what’s merely “not our vibe.”
Step 2: Select YouTube inventory types and baseline exclusions. Decide whether Expanded, Standard, or Limited inventory fits each campaign’s risk profile, then set initial content category and label exclusions.
Step 3: Configure keyword, topic, and placement controls. Build negative keyword lists, topic exclusions, and channel/video placement exclusions (or allow lists) tied to your policy, not gut feel.
Step 4: Create an escalation and monitoring process. Assign owners, define what counts as an incident, and set a cadence for reviewing placement reports and blocked inventory.
Step 5: Review business impact with RevOps and finance. Track how controls affect reach, CPM, cost per qualified lead, and cost per opportunity, then adjust guardrails without choking delivery.
Everything below expands each lever, with an emphasis on “safe enough to scale,” not “so strict nothing runs.”
Why B2B brand safety on YouTube behaves differently
YouTube is not LinkedIn, not search, and not a neat little publisher bundle. It’s an open platform at global scale, driven by user-generated content and creators with wildly different tones. Even within a single channel, a video can shift from professional to polarizing mid-stream.
For B2B, that volatility matters more because:
Regulated and reputation-sensitive industries have less room for error. Think fintech, healthcare IT, cybersecurity, HR tech, and anything selling into government or enterprise procurement.
Niche audiences amplify context. When your ICP is small, the wrong adjacency can get noticed internally and externally fast.
Long buying cycles extend the “memory” of a bad impression. A negative association can follow a prospect across multiple touches: video, retargeting, email, SDR outreach, and meetings.
The right mental model is brand suitability, not blanket avoidance. Suitability means defining what context is appropriate for your ICP and values, then using YouTube brand safety controls to enforce that standard. Google’s framing of safety and suitability, aligned with GARM brand suitability concepts, is a useful starting point (see Think with Google’s example: How BT put brand safety and suitability first).
Core objectives and use cases for B2B brand safety controls
Sophisticated YouTube advertisers invest in placement and safety controls for three reasons that have nothing to do with “playing it safe” and everything to do with scaling responsibly:
Protect brand equity and employer brand. Your ads are a public statement about who you are and what you tolerate.
Make YouTube defensible in CFO and board conversations. A channel that can’t explain its controls gets its budget questioned first.
Enable confident budget increases. The more you spend, the more impressions you buy. Controls reduce “unknown unknowns.”
Typical B2B use cases where brand suitability controls become non-negotiable:
Post-funding category creation: you’re suddenly visible, competitors are watching, and leadership is sensitive to PR risk.
Regulated software: compliance expectations push you toward conservative inventory and tighter exclusions.
Cybersecurity: you can’t look careless about scams, misinformation, or “get-rich-quick” ecosystems that erode trust.
HR tech and people platforms: adjacency near harassment, hate speech, or exploitative content can be reputationally disastrous.
Top of funnel: risk posture when just building awareness
TOFU campaigns usually need broader reach, but still need guardrails. For most B2B brands, that means Standard or Limited inventory, plus exclusions that reduce sensational adjacency. Keep it simple: avoid violent or shocking content, misinformation-adjacent themes, and conspiracy ecosystems.
Some “news” and commentary can be acceptable if it matches your audience and values, but controversial social issues, political extremism, and scammy content clusters are almost always a net-negative for B2B awareness.
Middle of funnel: staying credible while educating buyers
MOFU creative (product explainers, case studies, webinars, POV content) benefits from relevant context: business, tech, SaaS, leadership, and industry education. This is where topic targeting can help, but it’s also where credibility becomes the point of the ad. Exclude clusters that undermine trust (scams, “overnight success,” manipulative finance content, or low-quality hype channels) even if they’re cheap inventory.
At this stage, a professional environment often matters more than raw reach.
Bottom of funnel: strict controls near high-intent offers
BOFU efforts (demos, pricing, trials, “talk to sales”) deserve the strictest posture: Limited inventory, conservative content exclusions, and potentially allow lists for known, high-quality placements. This is where one off-brand adjacency can show up in screenshots, Slack threads, and deal rooms.
Understanding YouTube’s brand safety toolkit
YouTube brand safety is not one setting. It’s a stack of levers that operate at different levels of granularity. A practitioner-friendly way to think about it:
Big levers that change scale fast (campaign-level): YouTube inventory types, digital content labels, sensitive content categories, and broader content exclusions for video campaigns.
Sharper levers for context precision (ad group/content-level): topic exclusions, keyword-based exclusions, and placement-level controls (channels/videos).
Operational layer: monitoring cadence, blocklist governance, escalation, and reporting.
Google’s official documentation is the source of truth for how content exclusions for video campaigns work and how to set them (see Google Ads Help). Treat any platform UI details as subject to change and verify before publishing internal SOPs.
Inventory types and what they mean for B2B
Inventory types are your first, most consequential suitability decision. They influence how much sensitive content you are willing to tolerate in exchange for reach.
Expanded inventory: Widest reach. More likely to include edgy, mature, or borderline-sensitive contexts. In B2B, reserve for controlled experiments or niche cases where scale is impossible otherwise.
Standard inventory: Default for many brands. Often the best starting point for B2B demand gen because it balances reach and risk.
Limited inventory: Most conservative. Useful for regulated brands, executive-visible launches, and BOFU campaigns. Tradeoff: reduced available inventory and potential CPM pressure.
For a deeper explainer of how Expanded, Standard, and Limited affect reach and safety tradeoffs, see Strike Social’s overview: Understanding YouTube Inventory Types.
If your leadership is nervous about advertising on YouTube, you can start with Limited to build confidence, then test Standard vs Limited with matched audiences and creative once you’ve proven controls and monitoring work.
Channel note: YouTube is rarely the only place your brand shows up. If you’re running multi-channel demand gen, align your suitability posture across platforms so your standards don’t contradict each other (for example, how you treat professional context on YouTube vs your LinkedIn advertising campaigns).
Content categories, sensitive themes, and digital content labels
Content exclusions typically combine three concept families:
Digital content labels: DL-G, DL-PG, DL-T, DL-MA, plus “Not yet labeled.” These labels help classify maturity and suitability.
Sensitive content categories: Categories like tragedy and conflict, sensitive social issues, mature content, and other themes you may want to avoid depending on brand posture.
Other content exclusions: Additional campaign-level content exclusions available in Google Ads video campaign settings.
A practical B2B approach: exclude what’s clearly misaligned (adult, hate, scams), be thoughtful with “news” adjacency, and avoid strangling delivery with overly aggressive exclusions. Many B2B brands can allow some commentary content if it’s relevant to the ICP, but they still exclude sensitive themes that predict controversy.
Third-party verification and brand safety partners
Third-party verification (IAS, DoubleVerify, and similar tools) can add monitoring and independent reporting, which matters when you have large budgets, global campaigns, or strict corporate policies. Treat them as an additional layer, not a substitute for correct Google Ads brand safety settings.
If you already use third-party verification in other paid channels, keep your definitions consistent. Otherwise, you end up with “safe” meaning five different things in five dashboards.
Applying keyword, topic, and placement exclusions
The tactical controls that prevent most “how did we end up there?” incidents are simple: negative keyword lists, topic exclusions, and placement exclusions. The mistake is treating exclusions like a scavenger hunt. Build them from your documented risk policy and ICP expectations, then iterate based on placement reports.
Keyword and topic exclusions for B2B advertisers
Start your negative keyword lists with obviously off-brand clusters, then add industry-specific patterns you know attract low-quality ecosystems.
Examples of “baseline” negative keyword themes (adapt to your policy):
Violence, gore, self-harm
Adult content
Political extremism, hate speech, or inflammatory identity content
Scams and fraud
Conspiracy and misinformation-adjacent phrasing
Examples of “B2B-specific” additions you often end up needing:
“hack”, “crack”, “torrent” (common in software piracy content ecosystems)
“giveaway”, “free money”, “no credit check” (varies by vertical)
Use topic exclusions to avoid entire clusters (tragedy, gossip, certain gaming subgenres) without trying to enumerate every keyword variant. Topic exclusions are especially helpful when a theme is consistently misaligned with your employer brand or buyer expectations.
Placement exclusions, blocklists, and allow lists
Placement controls are where brand safety becomes operational, not theoretical:
Placement exclusions (blocklists): Use placement reports to identify problematic channels or videos, then add them to a shared exclusion list that’s applied across campaigns.
Allow lists: Curated sets of vetted channels. Useful for high-stakes BOFU offers, regulated brands, or situations where leadership wants near-zero ambiguity.
A workable pattern for most B2B teams: start with Standard inventory plus baseline exclusions, then refine with blocklists as you learn. For regulated brands, flip it: start with allow lists and expand cautiously.
How to build a safe but scalable campaign structure
The fastest way to create confusion is mixing different risk postures inside the same campaign. The cleanest approach is mapping safety settings to funnel stages and campaign intent, then making those settings repeatable defaults.
Step 1, Define your risk profile and non-negotiables
Before you touch Google Ads settings, write down your suitability guardrails with the stakeholders who will hold you accountable later (marketing leadership, legal, comms, HR, and sometimes finance).
Use questions like:
Which types of content can we never appear next to?
Are we comfortable near news or opinion content? If yes, what kind?
What topics are uniquely sensitive in our industry?
What would create an internal incident if a prospect or employee screenshotted it?
This becomes the north star for inventory, exclusions, and monitoring.
Step 2, Map inventory and exclusions to funnel stages
Assign inventory types and baseline exclusions by campaign type, then make it a rule, not a debate. A simple framework:
Expanded: rare, experimental, and only when you can tolerate risk and need incremental scale.
Standard: the default for most B2B demand programs.
Limited: high-stakes campaigns, regulated industries, BOFU, or when exec confidence is the constraint.
Repeatability matters. If every campaign is configured from scratch, you will eventually miss something.
Step 3, Configure settings and test placements in Google Ads
Exact UI labels change, so verify against the latest Google Ads documentation before finalizing SOPs. That said, an experienced practitioner can typically find the key controls in these paths:
Campaign-level suitability: Google Ads → Campaigns → select your Video campaign → Settings → find Content exclusions / Inventory type options and apply your defaults.
Keyword and topic exclusions: Google Ads → Campaigns → Audiences, keywords, and content → Content → add Exclusions (topics) and negative keyword lists where applicable.
Shared placement blocklists: Google Ads → Tools & Settings → Shared library → Placement exclusion lists (create and apply across campaigns).
Then run a low-budget test campaign for a short window and review placement reports before scaling. You’re not only checking performance. You’re checking whether your guardrails behave as expected.
Step 4, Early performance and safety monitoring
The first 1–3 weeks are where most teams either build confidence or panic. Monitor both suitability signals and performance signals:
Blocked or limited inventory spikes: a sign your exclusions may be too restrictive for the audience/creative combination.
Cost shifts after tightening exclusions: CPM and CPV may rise when you remove cheaper inventory.
Performance drops: sometimes caused by over-filtering; sometimes caused by losing the contexts where your message resonates.
Adjust iteratively. If you tighten everything at once, you won’t know which control caused the tradeoff.
How to measure and report on brand safety performance
Brand safety is not just “we didn’t get yelled at.” The real goal is proving you can buy safe reach efficiently and still drive pipeline. Define a small set of KPIs that connect platform controls to business outcomes.
Awareness, suitability, and context metrics
Track metrics that reflect where your ads actually ran and how controlled that environment was:
Share of impressions by inventory type (Standard vs Limited)
Share of impressions on vetted placements (if using allow lists or curated bundles)
Count of excluded placements added per week (a proxy for how much refinement is happening)
Blocked impressions or “limited by exclusions” signals (where available in platform reporting)
Pair those with awareness and engagement signals that reflect creative effectiveness in the environments you’re buying: view rate, watch time, engaged views, and any brand lift study outputs if you run them.
Impact on reach, efficiency, and pipeline
To evaluate whether controls are too strict or too loose, watch for:
Reach and frequency: did you choke delivery to the point where the channel can’t do its job?
Efficiency: CPM, cost per engaged view, cost per qualified lead, and cost per opportunity
Pipeline quality: do “safer” environments correlate with better downstream conversion or deal velocity?
When possible, run side-by-side tests (for example, Standard vs Limited inventory) with matched creative and audiences. Interpret the tradeoff in terms of LTV:CAC and pipeline outcomes, not CPM alone.
Reporting brand safety to executives
Executives do not want a 40-tab spreadsheet of exclusions. They want confidence. A simple slide structure works:
Current settings: inventory type, key exclusions, whether allow lists are used
Incidents or escalations: what happened (if anything), what you changed, and why it won’t repeat
Key metrics: suitability/context metrics plus performance and pipeline
Next experiments: what you’ll test to improve scale without increasing risk
This keeps the conversation grounded: brand protection and revenue are managed together.
YouTube brand safety pre-launch checklist
Use this pre-launch checklist before pushing any new YouTube campaign live. It’s designed to catch the common “we forgot that setting” failures.
Risk profile confirmed with stakeholders (marketing, legal, comms, HR).
Non-negotiable content adjacency list documented and accessible to the team.
Inventory type selected per funnel stage (TOFU/MOFU/BOFU) and noted in the campaign brief.
Digital content label exclusions applied (per your policy).
Sensitive content category exclusions applied (per your policy).
Baseline content exclusions for video campaigns applied at the campaign level.
Topic exclusions applied for chronic misalignment categories.
Initial placement exclusions in place (known bad channels/videos removed).
Allow list created and applied for strict campaigns (if required).
Shared placement blocklist structure defined (who can add, review cadence, naming conventions).
Low-budget test run launched (limited spend, short window) before scaling.
Placement report reviewed from the test run and blocklist updated.
Escalation plan defined (what counts as an incident, who’s notified, response time).
Measurement views created: inventory type distribution, placement reporting, and pipeline tie-out plan with RevOps.
FAQ: Brand safety for advertising on YouTube
Note: Platform settings and definitions can change. Verify policy details, UI paths, and any reporting fields against the latest Google Ads and YouTube documentation before publishing or operationalizing.
What is YouTube brand safety vs brand suitability?
Brand safety focuses on avoiding clearly unsafe content (illegal, hateful, or otherwise high-risk). Brand suitability is more nuanced: it’s about the contexts that are acceptable for your specific brand and ICP. Think with Google’s guidance on safety and suitability, aligned with GARM-style suitability thinking, is a solid foundation (thinkwithgoogle.com).
How does YouTube protect brand safety for advertisers?
YouTube combines automated systems, human review, and advertiser controls to reduce the likelihood of ads appearing next to unsafe content. Advertisers can further tighten exposure using inventory types, excluded content categories, and placement controls in Google Ads. For a platform-level overview, reference Think with Google’s brand safety and suitability framework (thinkwithgoogle.com).
What are YouTube inventory types?
Inventory types (Expanded, Standard, Limited) let you decide how much sensitive content your ads can run against. Expanded allows the widest range, Standard is the default for many brands, and Limited avoids most sensitive themes but can restrict scale. Confirm the latest definitions in Google Ads Help (support.google.com).
What are content exclusions in YouTube Video campaigns?
Content exclusions let you opt out of certain content types, digital content labels, and sensitive categories (for example, tragedy, sensitive social issues, or mature audiences). They are configured at the campaign level in Google Ads and prevent matching to excluded inventory. See Google Ads Help for “About content exclusions for Video campaigns” and setup steps (support.google.com).
Can you fully block certain topics or channels when advertising on YouTube?
You can exclude topics and placements (channels/videos) and maintain blocklists or allow lists, but “fully block” depends on how you define the topic and how content is categorized. The practical approach is layering: inventory selection plus content exclusions plus topic/keyword exclusions plus placement governance.
How quickly should delivery stabilize after tightening exclusions?
Expect some short-term volatility after major changes, especially if you move from Standard to Limited inventory or add broad topic exclusions. A pragmatic approach is to make one meaningful change at a time, monitor placement reports and key KPIs for 1–3 weeks, and adjust iteratively. For official guidance on exclusions and campaign configuration, verify current recommendations in Google Ads Help (support.google.com).
Run safer YouTube advertising with Abe
Abe treats brand safety and revenue as a single problem, not a tradeoff. We help B2B teams define risk tolerance, configure YouTube’s brand suitability controls, and continuously measure impact on both brand protection and pipeline as programs scale.
Our Customer Generation™ methodology, first-party data mindset, and experience managing $120M+ in annual ad spend across social channels means brand safety is built into the operating system, not bolted on after someone panics.
GUIDES
4 minute read
Brand Safety and Placement Controls for B2B on YouTube
The real fear is not testing TikTok. It’s picking the wrong TikTok ads agency and burning budget on views that never turn into pipeline. This guide gives you a practical selection playbook with a TikTok-specific RFP kit, a revenue-tied scoring rubric, and a scorecard you can use to defend the decision to finance and sales. Abe brings the same rigor we use across $120M+ in annual ad spend and 150+ brands, so your TikTok test holds up under scrutiny.
How to select a TikTok ads agency for B2B (step by step)
This is the repeatable process: go from “we should test TikTok” to “we picked a partner and scoped a pilot” without relying on vibes. The goal is not just finding a creative shop. It’s selecting an accountable TikTok marketing partner who can plug TikTok into Customer Generation™ and the way your business actually makes money, including LTV:CAC expectations and payback guardrails.
Suggested selection funnel:
Step 1, Align on goals, ICP, and TikTok’s role in your funnel
Before you evaluate agencies, decide what TikTok is supposed to do in your mix. For most B2B teams, TikTok is not replacing high-intent search. It’s typically used to reach specific ICPs efficiently, create familiarity, and warm accounts so other channels convert better.
Write down revenue goals, guardrails, and decision-makers upfront. If finance and sales will have to defend this spend later, involve them now.
Which markets and ICP tiers will TikTok focus on?
What share of paid social budget is on the table for a 3–6 month test?
How will success be measured beyond last-click CPL? (Examples: assisted pipeline, influenced opportunities, on-site engagement quality, account-level lift, incrementality tests.)
What are your guardrails? (Target LTV:CAC, payback expectations, minimum lead quality thresholds.)
Who must sign off? (CMO, finance, sales leadership, RevOps, legal/compliance.)
Step 2, Decide the scope you actually need from a TikTok ad agency
“Agency” can mean anything from a media buyer with access to Ads Manager to a full system that produces TikTok-native creative and connects performance to pipeline. Decide whether you need a full-funnel partner or a narrower execution shop.
Core scope components to define:
Strategy and experimentation plan (testing roadmap, hypotheses, learning agenda)
Media buying and daily optimization (bidding, budgeting, targeting, placements)
UGC and creator management (briefs, sourcing, contracts, usage rights)
Editing and post-production (hook testing, cutdowns, captioning, iterations)
Analytics and attribution (pixel, Events API, offline conversions, UTMs, dashboards)
Cross-channel coordination (retargeting, sequencing, and creative alignment)
Use a simple decision grid internally: what your team owns (messaging, approvals, CRM governance), what the agency owns (TikTok-native creative systems, optimization, reporting), and what is shared (landing pages, offers, measurement definitions). If you already run coordinated programs across LinkedIn and Meta, make sure TikTok does not become a silo. This is also where it helps to align with your existing LinkedIn advertising agency support, your Meta advertising agency motion, and any supporting distribution you run through a Twitter advertising agency or a YouTube advertising agency.
Step 3, Build your longlist and shortlist
Start with places where proof is easiest to validate: the TikTok Marketing Partners directory (including the badged Agency category), peer recommendations, and partners who already know your business. A TikTok badge can be a helpful signal of platform experience, but it is not a guarantee of fit for complex B2B.
MediaPost notes TikTok added an “Agency” category to its Marketing Partners Program, positioning “badged TikTok Agency Partners” as agencies with a track record on the platform (MediaPost, 2023).
Quick disqualifiers for your longlist:
No clear TikTok examples (even adjacent to your category)
Pure DTC or ecommerce focus with no B2B motion fluency
No plan for first-party data and CRM-based measurement
Vague ownership of ad accounts, pixels, or creative usage rights
Cut to a shortlist of 3–5 agencies before issuing a full RFP. More than that and you create work without improving decision quality.
Step 4, Run a structured RFP and pitch process with clear timelines
Run the process like you would any other revenue-critical vendor selection. Clear milestones reduce bias and make it easier to compare answers across agencies.
RFP draft and internal approval: include scope, goals, budget range, tech stack, constraints
Distribution date: send to the same shortlist on the same day
Q&A window: keep a shared Q&A doc so all agencies see the same answers
Submission deadline: commonly 1–2 weeks after release, depending on complexity
Pitch meetings: commonly 60–90 minutes each, over 1–2 weeks
Final decision: after scoring and reference checks
Keep comparisons fair by sharing the same inputs with every agency: budgets, ICP, examples of past creative, performance history (good and bad), and your current stack (analytics, CRM, attribution tooling). If agencies are “guessing” what you want, you are not selecting the best partner. You are selecting the best guesser.
Step 5, Score agencies against revenue-focused criteria
Make the decision with a rubric, not gut feel. TikTok can look great in a deck because the top-of-funnel metrics are often cheap. Your rubric should force a clear answer to the harder question: can this agency translate TikTok reach into pipeline contribution in a way finance and sales will accept?
Use categories that reflect revenue impact, not presentation polish: TikTok expertise, UGC and creative engine, brand safety, measurement, B2B alignment, team fit, and commercials. If you want a ready-to-use worksheet you can share with stakeholders, request the downloadable TikTok agency RFP & scorecard through our TikTok advertising agency page and use it to standardize scoring across reviewers.
Step 6, Select your partner and design a low-risk pilot
Pick the winner based on total score and qualitative fit, then contain risk with a defined pilot. Avoid open-ended engagements where “learning” becomes a substitute for performance.
What a smart pilot looks like:
Time-boxed: 3–6 months
Clear spend range: enough budget to learn, not enough to create career risk
Specific objectives: examples include warming ICP accounts, increasing qualified registrations, improving retargeting efficiency in other channels
Pre-agreed success metrics: tied to pipeline contribution and LTV:CAC expectations, not just CTR or view-through rate
Include contract details in the RFP so negotiation is not a surprise: who owns ad accounts and creative, notice periods, data access, and how you handle creator usage rights and whitelisting.
Why B2B TikTok agency selection goes wrong
Smart teams still hire the wrong TikTok partner because they assume TikTok behaves like LinkedIn and search. It does not. Targeting can be looser, creative demands are heavier, and attribution is noisier. That means the agency’s operating system matters more than the agency’s pitch.
Mistake 1, Chasing followers and views over revenue
Some agencies sell virality: followers, views, and “we got you on trend” energy. In B2B, that can look like a flashy, trend-chasing feed that never sends qualified traffic to webinars, product pages, demo flows, or content that sales actually uses.
The impact is predictable: leadership loses trust in the channel, future tests get blocked, and your LTV:CAC looks worse because TikTok spend never connects to Customer Generation™ reporting.
Mistake 2, Underestimating UGC and creative operations
The most common failure mode is hiring a media-only shop with no real creative engine. You end up with a handful of repurposed LinkedIn assets, fast fatigue, and performance that stalls even if the buying is competent.
Abe’s POV: TikTok burns through creative faster than LinkedIn. Plan for 5–10 fresh variations per month at minimum, supported by a pipeline that can write hooks, script, edit, and iterate. Without that, you do not have a TikTok program. You have a short-lived test that fails for operational reasons.
Mistake 3, Ignoring brand safety and suitability
Brand safety and brand suitability are related but different. Brand safety is avoiding harmful content. Brand suitability is avoiding content that is not a fit for your brand’s tone or risk profile. TikTok highlights native controls and third-party verification partners as part of its advertiser safety toolkit (TikTok for Business, 2023), and it also documents suitability controls that help advertisers control where ads appear (TikTok for Business: Brand Suitability).
If you do not probe this in the RFP, regulated or risk-sensitive B2B brands can end up next to questionable content, triggering internal escalation and slowing approvals. That does not just create reputational risk. It also creates timeline risk.
Mistake 4, Accepting vague measurement and reporting
Hand-wavy reporting is easy to spot: lots of top-of-funnel metrics, no clean UTM discipline, and no credible connection to CRM or opportunity data. TikTok attribution can be inherently noisy, which makes methodology more important, not less.
Require a clear measurement plan in the RFP: which metrics you will track, how TikTok data connects to your CRM, and how assisted pipeline will be reported in a way finance can audit.
Mistake 5, Rushing timelines and skipping stakeholder alignment
The common pattern: marketing does a fast vendor search, picks based on chemistry, then hits internal friction from sales, RevOps, legal, or procurement. TikTok’s perceived “riskiness” makes a transparent process and stakeholder buy-in even more important than with safer-feeling channels.
RFP kit: TikTok ads agency requirements and scorecard template
This section is the copy-paste toolkit: TikTok-specific RFP sections you can drop into your doc, plus a scoring rubric structure you can use as an agency scorecard. Use it to keep evaluations comparable and to prevent the process from turning into “best deck wins.”
TikTok-specific requirements to include in your RFP
UGC and creative production: Ask agencies to detail their TikTok-native creative process: volume they can produce per month, whether they manage creators/UGC (including usage rights), how they script and edit, and how they test hooks, lengths, and formats. If you are evaluating a TikTok UGC agency specifically, require clarity on creator sourcing, review workflows, and how they prevent “samey” creative over time.
Brand safety and suitability: Require a section on how they use TikTok’s brand safety and suitability tools, any third-party verification partners they work with, and how they will adapt settings to your risk profile and regulatory constraints. TikTok outlines both its safety partners and its suitability controls in its advertiser resources (Introducing TikTok’s Brand Safety and Suitability Partners; Brand Suitability: Control Where Your Ads Appear).
Measurement and reporting: Specify expectations for connecting TikTok to your analytics and CRM: pixel/Events API setup, offline conversions, UTMs, dashboards, and cadence of performance reviews (weekly, monthly, quarterly). Also require definitions: what counts as a qualified lead, what counts as influenced pipeline, and how you will handle view-through and assisted conversions.
Data, privacy, and account ownership: Clarify who will own the TikTok Ads Manager account, who has admin access, how data will be stored, and what happens to audiences and creative when the relationship ends. This is also where you define security reviews and legal constraints, especially if you operate in a regulated category.
B2B strategy and Customer Generation alignment: Ask how they will align TikTok with your ICP, total addressable market (TAM), and multi-channel mix (LinkedIn, search, outbound), and how they will model TikTok’s impact on LTV:CAC. The point is to avoid a standalone “TikTok plan” that has no relationship to revenue reality.
Account structure: Require a plain-language description of how they structure campaigns and testing (naming conventions, creative testing methodology, audience strategy, learning phases), and how they keep learnings organized so your team can reuse what works.
Scoring rubric and downloadable scorecard template
Define 6–8 scoring categories with weightings that favor revenue impact over presentation polish. Use a simple 1–5 scale per category, where “3” is acceptable, “4” is strong, and “5” is exceptional with evidence. Have each reviewer score independently, then average scores per category and apply weights to produce a total score per vendor.
Recommended scoring categories and weights (example):
How to run scoring across reviewers:
Have each stakeholder score independently first to avoid groupthink.
Average each category score across reviewers.
Multiply the average by the category weight.
Sum weighted scores for a total per agency.
Use the pitch meeting to resolve major scoring gaps, not to negotiate everyone into the same opinion.
Questions to ask a TikTok ads agency in B2B pitches
Use pitch meetings to pressure-test the agency’s operating system. The best questions are the ones that force specifics: who does the work, how fast they iterate, how they manage risk, and how they connect performance to revenue. For more practical question framing, 9 Clouds publishes a helpful checklist of TikTok vetting questions (9 Clouds, updated 2025).
Strategy, creative, and UGC questions
How do you adapt B2B stories to TikTok’s culture without making the brand cringe?
What does your creative pipeline look like month to month? Who writes, who edits, who approves?
How many fresh concepts and variations can you realistically produce each month?
How do you test hooks, lengths, and formats, and how do you document learnings?
How do you source and manage creators or UGC, and how do you handle usage rights?
Show us 3 TikTok campaigns where you turned views into tangible B2B outcomes.
What do you do when performance drops due to creative fatigue?
What do you need from our team to keep production moving fast?
Brand safety, data, and account ownership questions
Which brand safety and suitability controls do you use on TikTok, and how do you configure them by risk profile?
Do you leverage any third-party verification partners? If yes, when, and how is it reported?
Who will own the TikTok ad account and audiences? Will our team have admin access from day one?
How do you handle compliance reviews for regulated industries?
What is your process when an ad is rejected or flagged, and how do you prevent repeats?
What is your policy for creator whitelisting, dark posting, and disclosure requirements?
Measurement, reporting, and ROI questions
How do you attribute TikTok’s impact when it rarely gets last click?
What does your standard reporting deck look like (weekly and monthly)?
How do you connect TikTok data to CRM and opportunity reporting?
How do you collaborate with RevOps and finance on LTV:CAC modeling?
What early indicators do you use before pipeline builds?
How do you run incrementality tests or holdouts when the business needs stronger proof?
Timeline: how long a TikTok agency selection should take
Based on general digital marketing RFP best practices, most organizations should plan on roughly 8–12 weeks from initial scoping to signed contract, plus onboarding and launch. Mighty Roar’s RFP guidance is a useful reference point for how to structure the process and manage selection mechanics and cites anywhere from a few weeks to a few months (Mighty Roar, 2025). Adapt the timeline to your procurement and compliance requirements.
Reminder: validate any SLAs, pricing, and platform-badge claims directly with vendors and in your contract language.
Draft the RFP using the TikTok-specific sections above
Build the initial longlist and cut to a shortlist
Week 3–6, RFP live, Q&A, and pitches
Issue the RFP to the same shortlist on the same date
Run a structured Q&A process with a shared Q&A doc
Collect submissions and normalize them into a comparable format
Invite shortlisted agencies to present with a standard pitch format
Score each pitch using the same rubric across reviewers
Week 7–10, Final diligence, contracting, and pilot setup
Check references (ideally including a client with similar complexity)
Run security and compliance reviews
Negotiate scope and commercials (including creative volume commitments)
Align on pilot success metrics and reporting cadence
Confirm account ownership, admin access, and data retention terms
Do not stretch this indefinitely. Momentum matters, and the longer you delay, the more likely internal stakeholders will treat TikTok as “nice to have” instead of a disciplined test.
FAQ: TikTok ads agencies for B2B
What should B2B marketers look for in a TikTok ads agency?
Look for proven TikTok experience, a real creative and UGC production system, clear brand safety processes, and the ability to tie performance back to pipeline and revenue, not just views. Ask for B2B case studies or adjacent examples that show how they turn attention into measurable business outcomes. (Source: 9clouds.com)
How can I tell if a TikTok ad agency is officially recognized by TikTok?
TikTok runs a Marketing Partners Program with an Agency category; you can use the directory to see if an agency holds an Agency Partner badge. It is a helpful signal of platform experience, but it is not a guarantee of fit for your specific B2B motion. (Source: mediapost.com)
How do agencies keep B2B brands safe on TikTok?
Reputable agencies use TikTok’s brand safety and suitability controls, and may use third-party verification partners where relevant. Your RFP should require them to name the tools, settings, and processes they use to control where ads appear and how risks are escalated. (Source: ads.tiktok.com)
Do I need a TikTok-specialist agency, or can my general social media agency handle it?
Many full-service social agencies can run TikTok, but B2B teams often see better results with partners who have TikTok-specific creative systems and testing processes. Ask directly about TikTok-native edit capacity and how they translate B2B narratives into short-form video that holds attention. (Source: 9clouds.com)
What budgets make sense for a TikTok test?
The right budget is the minimum needed to test multiple creative concepts, audiences, and offers without underpowering learning. If you cannot fund consistent creative iteration and measurement setup, you are likely to get inconclusive results. Start with a controlled spend range that your finance partner can live with, but that is large enough to produce decisions, not opinions.
How long does it take to select and onboard a TikTok ads agency?
General RFP guidance suggests planning for roughly 8–12 weeks from scoping through pitches and contracting, plus onboarding and launch time. In regulated environments, compliance and procurement can extend that timeline, so build in buffer and keep stakeholders aligned. (Source: mightyroar.com)
Scale B2B TikTok Performance With Abe
Even with a strong rubric, most internal teams do not have the time to deeply assess creative systems, measurement setups, and cross-channel implications. Abe is the B2B paid social partner that treats TikTok as one part of a disciplined Customer Generation™ methodology, not a standalone stunt channel.
We bring TikTok into the same first-party data and financial modeling rigor used on LinkedIn and Meta, balancing TikTok’s low-cost reach with accountable pipeline and LTV:CAC discipline. We will not promise virality. We will design TikTok to support revenue.
Design TikTok tests that align with your ICP, TAM, and revenue model instead of generic “brand awareness” goals.
Build and refresh TikTok-native creative systems (including UGC-style video and creator collaborations) without overloading your internal team.
Implement measurement that connects TikTok impressions to CRM, opportunities, and assisted revenue, so spend decisions hold up in front of finance.
Coordinate TikTok with LinkedIn and other paid channels so warm audiences see the right message, on the right platform, at the right time.
Most B2B teams either do not have TikTok benchmarks, or they are borrowing e-comm numbers that do not translate to long sales cycles and high-consideration offers. This guide gives realistic performance reference points you can actually use inside TikTok advertising manager, plus a practical playbook for turning CPM, CTR, and cost per conversion into budgets, goals, and creative tests. The goal is not to “grade” your account, it is to set expectations, create internal benchmark bands, and improve month over month inside a broader Customer Generation™ program.
How to use TikTok benchmarks inside TikTok Ads Manager
This is the single actionable module in this article: a five-step Steps Playbook for using benchmarks as guardrails (not scorecards). Expect 2–3x swings by vertical, geo, and offer. Prioritize trend over perfection.
Define the business goal and your north star metric. Start with what the business needs, not what the platform makes easy to measure. Examples of north star metrics for B2B TikTok ads include pipeline created (influenced), qualified lead volume, cost per opportunity, or blended CAC impact. Decide where TikTok sits in your funnel (awareness, consideration, or retargeting conversion) so you do not hold a TOFU campaign to BOFU standards.
Pull your current baseline from TikTok Ads Manager (and lock the timeframe). In TikTok Ads Manager, export performance for a consistent window (for example, the last 30 days) and segment by campaign objective and audience temperature. Pull at least: impressions, spend, CPM, CTR, clicks, and your primary conversion event (demo request, trial, content download). If your CRM is the real source of truth, ensure UTMs and lead source fields are mapped before you interpret anything.
Compare to industry benchmarks (general vs. B2B), then pick the right “peer set.” Many public TikTok benchmarks skew toward ecommerce and consumer apps. Use cross-vertical stats as a sanity check for platform-level reality (for example, typical CPM levels or average CTR across verticals), then anchor your expectations to B2B-specific datasets where you have them. When your numbers are “worse” than cross-vertical benchmarks, ask: is that because of B2B targeting, offer friction, geo competition, or creative?
Decide how aggressive you can be based on LTV:CAC (and deal economics). Benchmarks are useless if they ignore unit economics. Translate “cost per conversion” into an acceptable CAC range using your funnel math: conversion-to-opportunity rate, close rate, ACV, and gross margin. This is where a CFO becomes a partner instead of a veto. Higher CPLs can be acceptable if the downstream revenue per opportunity and LTV:CAC pencil out.
Turn that into concrete budgets, bids, and creative test plans. Set a test budget that is large enough to learn (stable delivery, enough impressions, enough clicks), then write down the hypotheses you are testing: audience, offer, hook, format, landing page. Separate “learning campaigns” from “efficiency campaigns” so you can keep experimenting without breaking your reporting. Benchmarks tell you where to look first (creative vs. audience vs. measurement), not what to blindly copy.
Reminder: treat benchmarks as a starting point, not a scoreboard. The healthiest programs improve month over month, even if they never match a generic “good TikTok CTR” screenshot from a consumer brand.
Key TikTok advertising benchmarks B2B teams should know
Most published TikTok benchmarks are dominated by ecommerce and consumer subscription products, which typically have simpler offers, shorter conversion paths, and broader targeting. For a baseline across verticals, Enrich Labs’ 2025 roundup (synthesizing 2024 Lebesgue data) cites roughly ~0.84% average CTR, ~0.46% conversion rate, and ~$3.21 CPM across verticals (Enrich Labs – TikTok Benchmarks 2025).
In B2B, lower CTRs and higher CPLs can still be healthy if pipeline quality is strong and LTV:CAC holds. Sanity-check TikTok against your LinkedIn and Meta programs, but do it with the right lens: TikTok is often an influence channel that improves blended performance, not a last-click lead machine.
Use this as a directional anchor for B2B SaaS efficiency, then map to your funnel math (conversion to opp, close rate) before judging success.
Reach and engagement benchmarks (CPM, CPV, CTR)
For B2B TikTok, your reach and engagement metrics tell you whether your creative is earning attention, not whether your product is “going viral.” The core metrics to watch in TikTok Ads Manager:
Impressions and CPM: your cost to reach the market.
Video engagement: 3-second views, 6-second views, average watch time, completion rate.
CTR: a proxy for “did the message create enough intent to leave the feed?”
Cost studies commonly put TikTok CPMs in the mid-single digits. Darkroom’s 2025 analysis cites roughly $4.20–$9.00 CPM as a typical range, with audience competition, geo, and format moving it up or down (Darkroom Agency – How Much Do TikTok Ads Cost in 2025?). On the engagement side, Enrich Labs’ cross-vertical CTR baseline (~0.84%) is a useful “platform reality” check, while Varos’ B2B SaaS median CTR (~0.64%) is often a more realistic peer set for B2B offers.
Creative is the lever. A practical rule of thumb in TikTok creative guidance is the “3-second rule”: if you do not earn attention immediately, the rest of the ad does not matter. For B2B, that usually means opening on a concrete GTM pain, not a logo animation. Examples:
“Your outbound reply rates did not drop. Your message did.”
“If your pipeline dashboard is green, but cash is not, here’s why.”
“Most ‘AI SDR’ demos hide the real cost. Let’s unpack it.”
One caution: low CPMs with very low CTR can be misleading. Cheap reach is not the goal. Affordable reach plus meaningful engagement is the goal, especially when you compare TikTok engagement to other paid social channels.
Conversion and cost-efficiency benchmarks (CPC, CPL, cost per conversion)
Efficiency metrics are where B2B teams can get themselves in trouble if they treat TikTok like a direct-response search channel. Define and monitor:
CPC: cost per click (useful, but easy to game with clicky creative that attracts the wrong audience).
CPL: cost per (qualified) lead (requires a definition of “qualified” that sales and RevOps agree on).
Cost per conversion: cost per defined TikTok conversion event (trial, demo request, high-intent asset).
Varos’ B2B SaaS benchmark cites a roughly $100 median cost per conversion (April 2025). That is a helpful anchor for planning and expectation setting, especially when your offer is genuinely high intent. It also reinforces a reality B2B leaders already know: higher-intent outcomes cost more, and that can be fine.
Do not chase the lowest CPC or the lowest CPL on TikTok. Instead, tie spend back to Customer Lifetime Value (CLTV) and LTV:CAC. A higher CPL can be acceptable if TikTok is expanding TAM coverage, reaching new buying committees, improving retargeting pools, or lowering blended CPL and cost per opportunity across channels.
Compared with LinkedIn and Meta for the same ICP, TikTok often trades precision for reach. LinkedIn tends to win on native B2B targeting. Meta tends to win on mature conversion tooling. TikTok can win when you have strong creative, strong first-party audiences, and the discipline to evaluate it on assisted pipeline, not last-click lead volume.
How benchmarks vary by funnel stage, geo, and offer
Benchmarks change meaningfully based on what you are asking the user to do.
Funnel stage: awareness campaigns optimized for reach or video views will usually show strong CPM and view metrics, but weak direct conversion. Retargeting and lead-focused campaigns typically have more expensive CPMs but better downstream efficiency.
Geo: Tier 1 markets and competitive metros tend to cost more than broad global targeting, consistent with TikTok cost analyses like Darkroom’s CPM range discussion.
Offer: low-friction content (short guides, checklists, webinars) typically converts more easily than high-commitment asks (demo requests, “talk to sales”).
Instead of forcing one universal benchmark, create internal benchmark “bands” by funnel stage. Keep them directional unless you have enough of your own data to be precise. A clean approach is to track three bands in reporting: TOFU (reach and views), MOFU (CTR and engaged sessions), BOFU (cost per conversion and downstream CRM quality).
What makes TikTok advertising different for B2B marketers
TikTok is a high-reach, often relatively low-CPM channel that can humanize complex B2B products quickly, but it lacks the firmographic precision B2B teams are used to on LinkedIn. Abe’s POV is straightforward: TikTok is best used as an awareness and influence layer that feeds LinkedIn, search, and outbound. It is usually not a standalone SQL engine.
Concrete differentiators vs. LinkedIn and Meta:
Creative-first culture: TikTok rewards native-looking creative and fast iteration more than polished brand ads.
Algorithmic distribution: the platform can find pockets of attention quickly, but you have to give it enough creative volume to learn.
Weaker native B2B targeting: you can still target, but it is not “job title and company size” out of the box like LinkedIn.
Creative refresh cadence: fatigue can arrive faster, so you need a repeatable creative system.
Messier attribution: view-through influence matters, and last-click often undercounts TikTok’s contribution.
Abe mitigates the limitations with first-party data (CRM lists, site audiences), disciplined retargeting, and finance-first modeling. If you are looking to balance TikTok with other channels, see how a Meta advertising agency and a YouTube advertising agency approach measurement and creative systems across the portfolio.
Core objectives and use cases for B2B TikTok campaigns
In B2B, TikTok works best when objectives map to revenue outcomes, even if the KPI is not “demo requests tomorrow.” Think awareness, education, and assisted conversion, then measure the handoff into the rest of the funnel.
Top of funnel, awareness
TOFU objectives include reach, ad recall, and video view completion behavior. Strong B2B TikTok ad concepts often look like:
POV rants: “POV: you are judged on pipeline, but you cannot control lead quality.”
Day in the life: show the ICP in context (RevOps, finance, IT, sales enablement) and the moment the problem shows up.
Myth-busting: “Job titles are not an ICP. Here is what actually predicts conversion.”
Quick frameworks: a 3-step teardown of a common process (handoffs, routing, scoring, onboarding).
Problem-solution stories: short, specific narratives that make complex products feel concrete.
Measurement here should connect to business outcomes like brand search lift, direct traffic, and increased engagement in channels where conversion happens (LinkedIn, email, sales outreach). TikTok is often the attention spark that makes later touches cheaper and more effective.
Middle of funnel, consideration
MOFU is where you convert attention into education. Retarget video viewers or site visitors with thought leadership clips, webinar promos, case-study snippets, and ungated assets that reduce friction. A simple play is “the playbook in 60 seconds” with a clear link to the full guide.
“Good” often looks like rising CTR and watch time among warm audiences, plus healthy click-to-consumption behavior relative to your other paid social channels. Judge performance by engaged sessions and CRM quality, not just raw clicks.
Bottom of funnel, conversion
BOFU TikTok for B2B is typically a retargeting engine: social proof, objection handling, pricing context, and offer-led creative (demo, trial, ROI consult) served to people who already signaled intent. This can show up as “TikTok cost per conversion” improvements in retargeting audiences even when cold traffic looks mediocre.
TikTok rarely drives last-click closed-won deals alone. It can, however, accelerate opportunities in flight and improve win rates by making the brand feel familiar and credible when the buyer later sees a LinkedIn ad, a Google search ad, or an outbound email.
Types of TikTok ad formats and placements for B2B
TikTok offers multiple placements, but most B2B teams should bias toward formats that allow fast testing and clear benchmarking in TikTok Ads Manager: in-feed and Spark Ads, plus retargeting audiences. High-impact takeovers can work, but they are rarely the best first step for B2B budgets and learning velocity.
In-feed and Spark Ads as core building blocks
In-feed ads are the standard units that appear in the For You feed. Spark Ads let you boost organic posts or creator content while keeping native engagement signals. For most B2B advertisers, these are the workhorses because they blend in and support iterative creative testing.
Cons: creative fatigue is real, and you need steady iteration.
Example creative angles that tend to move CTR and watch time without gimmicks:
Cold open with a bold claim: a precise statement your ICP agrees with.
Fast on-screen text framework: “3 reasons your attribution is lying.”
Product-in-use screens with VO: show, do not tell, especially for workflow tools.
High-impact placements (TopView, Brand Takeover)
TopView and Brand Takeover formats are built for mass awareness and major launches. They can deliver significant reach quickly, and their CPMs can sit above auction-based in-feed units because you are buying premium attention.
When a B2B brand might consider them: large ACV, category creation, major events, or moments where a short burst of reach has real strategic value. When to skip them: early-stage testing, limited creative bandwidth, or when you still need baseline benchmark data from in-feed performance.
Retargeting and support formats
Retargeting is where many B2B TikTok programs find their most defensible efficiency. Use video-view and engagement audiences (for example, people who watched meaningfully) plus website visitors and CRM lists to deliver BOFU creative: customer quotes, objection-busting, short “what happens after you book a demo” explainers, and pricing-context clips.
TikTok Promote can be useful for light boosting, but serious B2B teams should primarily rely on full Ads Manager campaigns for control, testing rigor, and benchmarking.
How to set up your first B2B TikTok benchmark campaign
The goal of a benchmark campaign is not to scale immediately. It is to generate clean baseline metrics you can compare to the benchmarks above, then use to plan the next wave of creative and funnel experiments.
Step 1, Set the foundation: goals, ICP, and economics
Pick one primary objective and make it measurable. For most B2B teams, a strong first test is either (a) mid-funnel content engagement (building qualified retargeting pools) or (b) retargeting conversions to a demo or trial page. Define ICP and TAM clearly, then run a quick LTV:CAC back-of-the-napkin model to set acceptable CPL and cost per opportunity guardrails.
Use first-party data wherever possible: upload CRM lists (customers, open opportunities, high-intent MQLs) to seed custom and lookalike audiences. This is consistent with Abe’s TAM verification ethos: start with who you actually want, then let the platform expand intelligently.
Step 2, Plan structure and audiences
Keep structure simple: one campaign, 2–3 ad groups, clear roles.
Ad group 1: CRM list and lookalike (if available).
Ad group 2: broad or interest proxies aligned to the ICP problem space.
Ad group 3: warm retargeting (video viewers, site visitors).
Use naming conventions that encode audience, offer, and funnel stage so reporting is not a scavenger hunt later. For initial budget allocation, skew toward TOFU reach if you need market coverage, but reserve a portion for warm retargeting so you can observe conversion behavior sooner. Avoid prescribing hard dollar amounts if you do not have spend constraints and unit economics defined.
Step 3, Build and launch in TikTok Ads Manager
Inside TikTok Ads Manager, choose an objective that matches your truth. If conversions are the goal, do not default to a traffic objective just because it delivers clicks. Select the right optimization event, keep placements consistent for learning, and avoid creating too many ad groups with tiny budgets.
QA checklist before you hit launch:
Pixel and/or Conversions API is firing correctly for the right events.
UTM parameters are present and consistent (campaign, content, creative hook).
Attribution windows are understood and documented for reporting.
Creative specs are correct, captions are readable, and CTAs are explicit.
Naming system supports later experimentation and creative-level analysis.
In days 3–14, you are mostly diagnosing delivery and creative, not “declaring winners.” Monitor: delivery stability, CPM and CTR relative to relevant benchmarks, and early conversion signals where applicable. If results are volatile day one, that is normal. Make changes after meaningful spend and enough data to reduce noise.
Reasonable CPM, weak engagement: rotate new hooks, improve first 3 seconds, adjust pacing and on-screen text.
Good CTR, weak conversion: check landing page-message match, form friction, and offer clarity.
Higher CPM but better lead quality: do not panic. Validate downstream pipeline before optimizing for cheaper reach.
How to measure and report on TikTok performance
A finance-first measurement philosophy for B2B: TikTok is judged on its contribution to pipeline and revenue, not on cheap impressions. That means you should expect multi-touch influence, view-through impact, and assisted conversions. If your reporting only rewards last-click, TikTok will always look worse than it is.
Metrics that matter at awareness and engagement
Track 3–5 TOFU metrics consistently:
Impressions and CPM
View-through behavior (3-second/6-second views, average watch time)
CTR (use cross-vertical baselines like ~0.84% as context, and B2B SaaS anchors like ~0.64% where relevant)
Common misreads: celebrating ultra-cheap CPMs paired with extremely low watch time, or over-optimizing for three-second views while ignoring whether people actually click or engage meaningfully.
Metrics that matter at consideration and pipeline
Connect TikTok clicks and sessions to mid-funnel actions: content consumption, webinar registrations, product page depth, self-reported attribution (“How did you hear about us?”), MQLs, and opportunities created. Use UTMs and CRM fields so RevOps can segment “TikTok touch” opportunities over time.
Include two reporting lines in your regular deck to educate stakeholders:
Assisted pipeline created (opportunities with TikTok touchpoints)
Opportunities influenced by TikTok (by campaign and creative theme)
Metrics that matter for efficiency and ROI
Track cost per key outcome (CPC, CPL, cost per opportunity, cost per customer), payback period, and LTV:CAC. Frame performance in terms of blended CAC across channels, not siloed CPL. TikTok can be “more expensive” on a narrow metric and still be net-positive if it improves the overall portfolio.
With executives, speak in tradeoffs: you might accept higher CPL on TikTok if it expands TAM coverage or improves win rate through familiarity, while LinkedIn and search capture the high-intent demand.
How TikTok connects to your B2B revenue stack
TikTok should plug into the same revenue engine as every other channel: CRM, marketing automation, and analytics. If you cannot see TikTok touches in your opportunity data, you will underinvest or overreact based on incomplete attribution.
Workflow example with HubSpot or Salesforce
An ideal workflow (HubSpot or Salesforce) looks like this:
TikTok ad click (and/or view) drives to a landing page with pixel/CAPI tracking and UTMs.
User completes a form (demo request, webinar, download) or starts a trial.
Lead is created in HubSpot or Salesforce, with lead source and channel fields populated from UTMs.
MAP scoring and qualification run (HubSpot scoring, or Salesforce + Marketo scoring), then routing rules assign to sales.
Opportunities are created and later analyzed for TikTok touches, including view-through nuance where appropriate.
TikTok-specific nuances that improve later reporting: consistent UTMs at the creative level (so you can map which hooks worked), and a clear policy for how you will treat view-through conversions in dashboards so stakeholders do not argue over definitions every month.
Governance and ownership
In most B2B orgs, paid social owns execution, RevOps owns data hygiene and attribution definitions, and finance or leadership owns budget and ROI expectations. A simple governance model works:
Quarterly strategy review: role of TikTok in the channel mix, creative themes, audience strategy.
Monthly performance sync: benchmarks vs. trend, creative learnings, pipeline influence.
SLAs: lead follow-up expectations so TikTok-sourced or TikTok-influenced leads are not ignored.
Testing roadmap and optimization playbook
Prioritize high-impact levers first: audience and offer combinations, then hooks and creative concepts, then bid and budget tweaks. Limit simultaneous variables so your learnings stay clean.
If your programs are not performing at all
This looks like: weak delivery, wildly off-benchmark CPM or CTR, and no meaningful conversions. Likely root causes:
Pixel/Conversions API misconfiguration or wrong event mapping
Hyper-narrow audiences that cannot deliver
Mismatched objective (optimizing for traffic when conversion is the goal)
Offer is off for TikTok context (too much friction, too little clarity)
Creative does not communicate the ICP pain fast enough
Tests to run first: broaden audience, simplify structure, validate measurement, and adjust offer clarity. Save micro-optimizations for later.
If your programs are underperforming
Underperformance is when campaigns deliver, but sit slightly worse than your benchmark bands on CTR or cost per conversion. This is usually a creative problem first, not a bidding problem.
Creative tests Abe consistently sees move engagement and conversion quality:
Add on-screen copy that summarizes the hook in plain language.
Shift to UGC style delivery (even for enterprise brands), less “brand video,” more “smart person talking.”
Reframe the opening line around a sharper pain or a clearer promise.
Use proof earlier (customer outcome, specific workflow moment), not at the end.
How to interpret your test results
CTR improves but conversion rate does not: the ad is earning clicks, but the landing page or offer is not closing. Fix message match and friction before changing targeting.
CPM rises but qualified leads improve: you may be paying more to reach the right buyers. Validate in CRM before optimizing for cheaper impressions.
Small differences early: assume noise when volume is low. Avoid declaring winners based on tiny samples.
Seasonality and geo shifts: costs can move with competition. Track trends month over month, not single-week snapshots.
One change at a time: if you change creative, audience, and landing page simultaneously, you learned nothing.
Expert tips and real world lessons
Treat TikTok as an assist channel, not your hero closer. Build it to influence pipeline and make the rest of your mix work harder.
Benchmark by funnel stage. A TOFU video views campaign should not be judged like a demo retargeting campaign.
Win the first three seconds. Lead with the buyer’s problem, not your product category.
Make the ad readable on mute. Strong on-screen copy improves clarity and often improves CTR and downstream quality.
Use proof earlier than you think. A customer result, a specific workflow, or a crisp “before/after” beats generic value props.
Expect creative fatigue. Plan for consistent shipping, not occasional “big campaigns.”
Do not optimize for cheap clicks. Cheap clicks can be expensive pipeline. Optimize for qualified outcomes.
Build first-party audiences early. CRM lists, site audiences, and engagement pools are where B2B efficiency often improves.
Report TikTok touches in opportunities. If you do not show influence, TikTok will always look optional.
Compare TikTok to your portfolio, not to internet screenshots. The right question is “does this improve blended performance?”
If you are pressure-testing partners or building your broader paid social bench, this roundup of best social media marketing agencies can help you see how different teams approach creative systems and measurement rigor.
FAQ: TikTok advertising manager benchmarks, pricing, and strategy
What is TikTok Ads Manager and how is it different from TikTok Promote?
TikTok Ads Manager is TikTok’s self-serve platform where advertisers create campaigns, choose objectives, set budgets and bids, target audiences, and monitor performance in one place. It is the control center for paid placements on TikTok. TikTok Promote is a lighter-weight boosting tool, but Ads Manager is where serious B2B teams run controlled tests and benchmark performance. Source: ads.tiktok.com.
How much does it cost to advertise on TikTok (CPM basics)?
Recent analyses suggest most advertisers pay roughly $4.20–$9.00 CPM (cost per 1,000 impressions) on TikTok, with costs moving based on geo, competition, and format. B2B targeting and Tier 1 geos often sit toward the higher end because the audiences are more contested. Source: darkroomagency.com.
Are TikTok ads right for B2B SaaS and services?
They can be, if your buyers are active on TikTok and you approach it as awareness plus influence, not just last-click lead gen. Creative demands are high, and attribution can be messy, so success usually comes from strong first-party audiences, retargeting, and measuring contribution to pipeline. Sources: embryo.com and shopify.com.
Is TikTok Ads Manager easy for marketers to use?
Most guides describe TikTok Ads Manager as relatively user-friendly: you can pick objectives, define audiences, upload creatives, and control budgets from a single dashboard. The complexity shows up in testing discipline, measurement, and reporting, especially for B2B funnels. Source: bir.ch.
How long does it take to see meaningful TikTok performance data?
You can learn quickly on reach and engagement (CPM, watch time, CTR), but meaningful conversion learnings often take longer in B2B because sales cycles are longer and attribution is multi-touch. The practical goal is to establish baseline benchmark bands in the first few weeks, then validate pipeline influence over the following months as CRM data accumulates.
Scale B2B TikTok performance with Abe
Abe treats TikTok as one piece of a disciplined Customer Generation™ methodology, grounded in first-party data, TAM verification, and financial modeling. The focus is not viral moments. It is predictable learning velocity, benchmark clarity, and pipeline-backed impact.
What that looks like in practice:
Benefit 1: Faster path to reliable benchmarks by plugging into Abe’s cross-client TikTok data and B2B-specific testing frameworks, instead of guessing or relying on ecom stats.
Benefit 2: Creative excellence at scale, motion-first and TikTok-native, produced in a system that can ship 5–10+ new variations per month without burning out internal teams.
Benefit 3: Revenue-focused measurement, including multi-touch attribution, assisted pipeline reporting, and LTV:CAC modeling so marketing, RevOps, and finance agree on TikTok’s role.
If you want a partner to interpret your TikTok Ads Manager data, compare it to B2B benchmarks, and design a roadmap to profitable programs, Abe can help as a TikTok advertising agency.


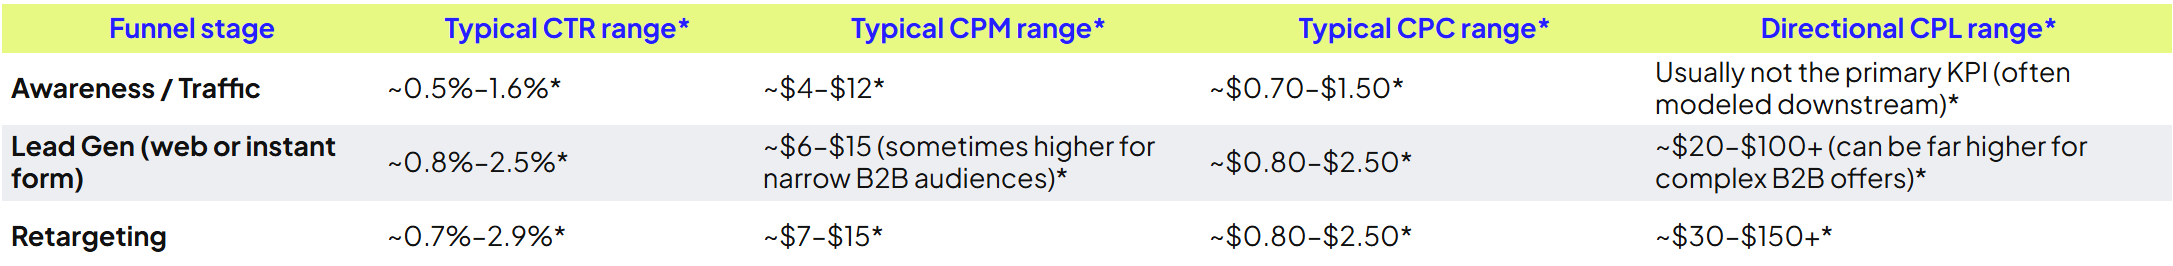
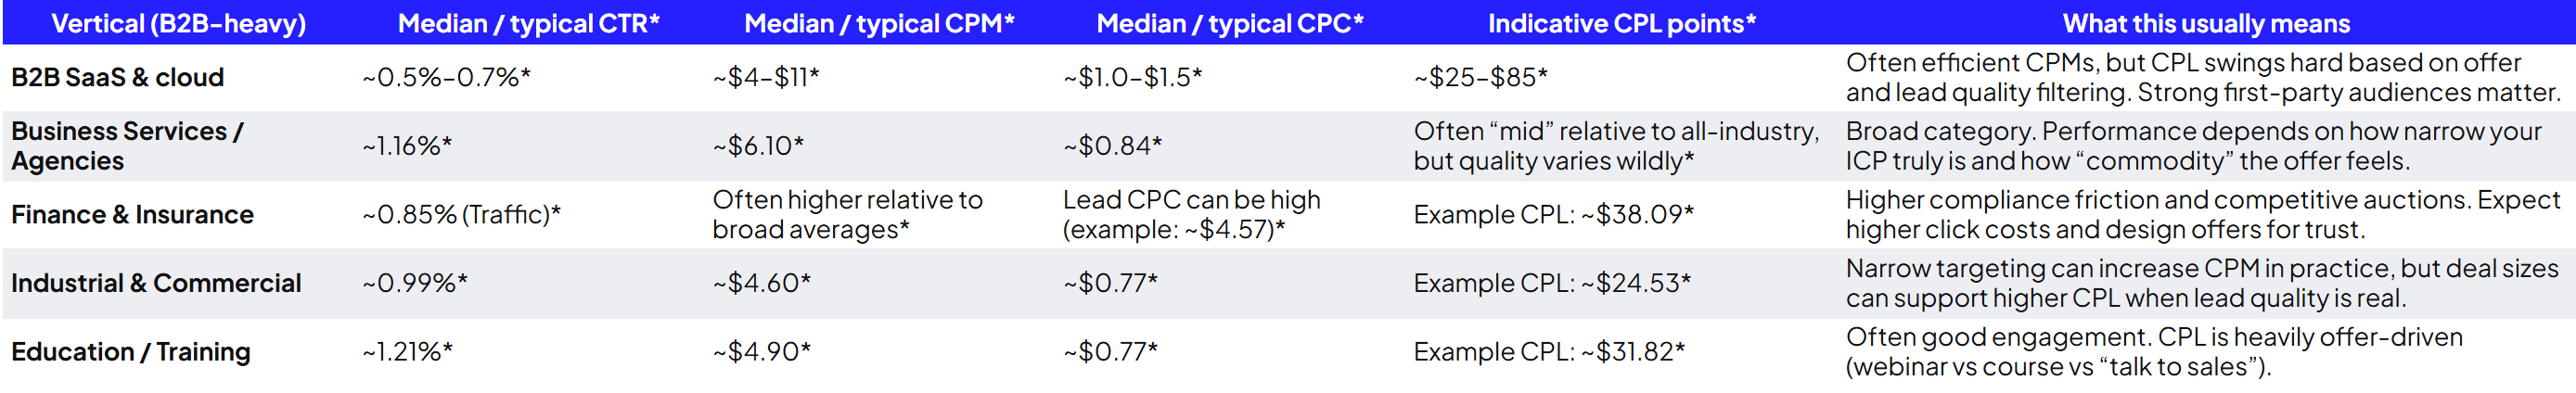
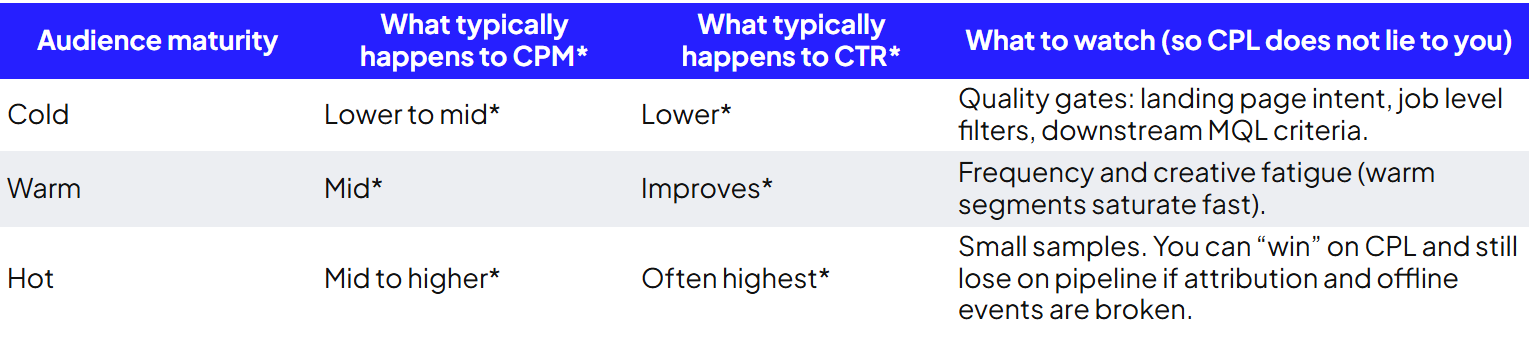
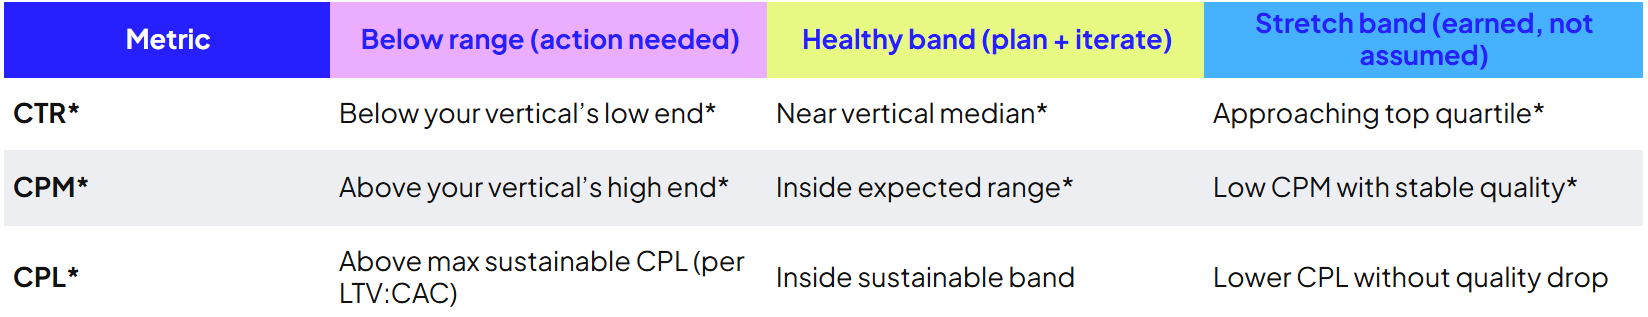
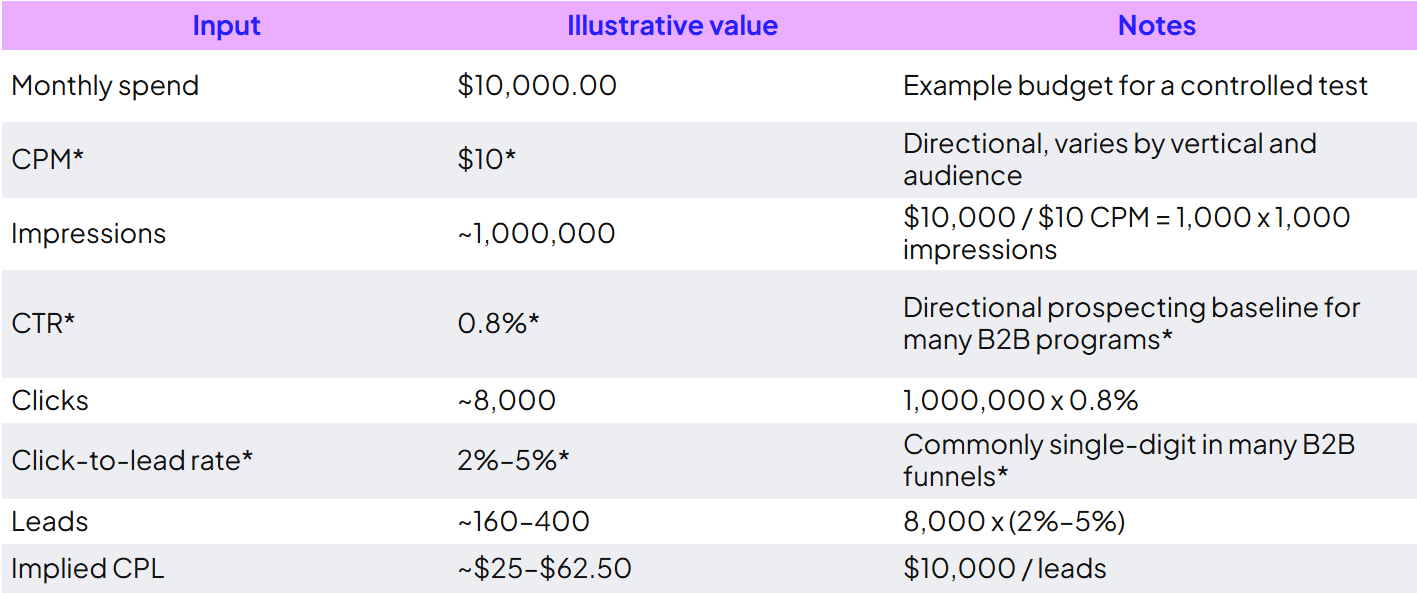
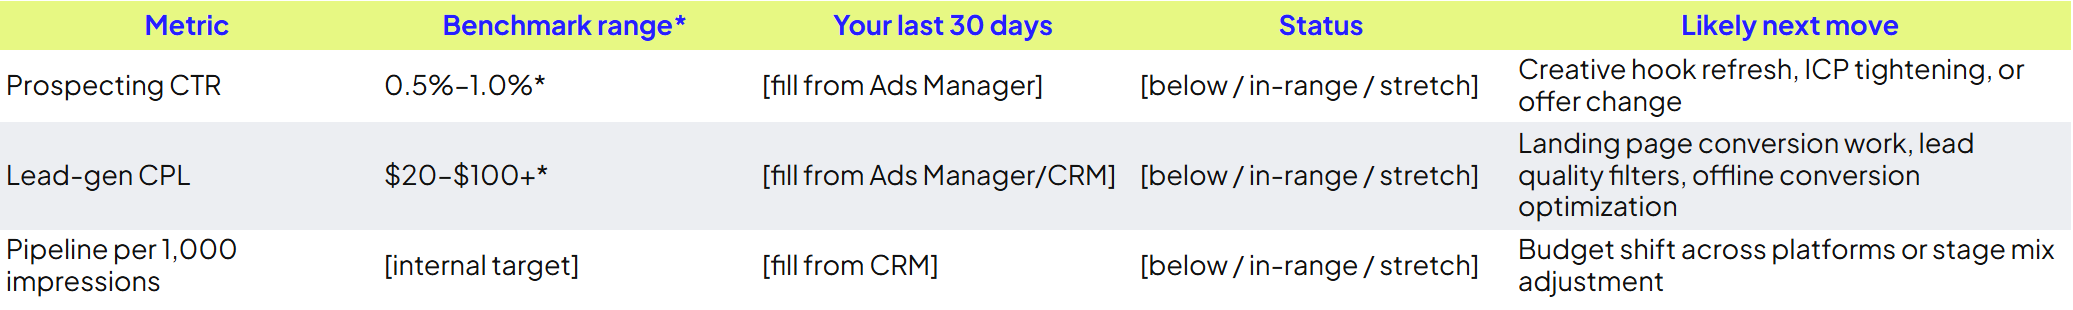

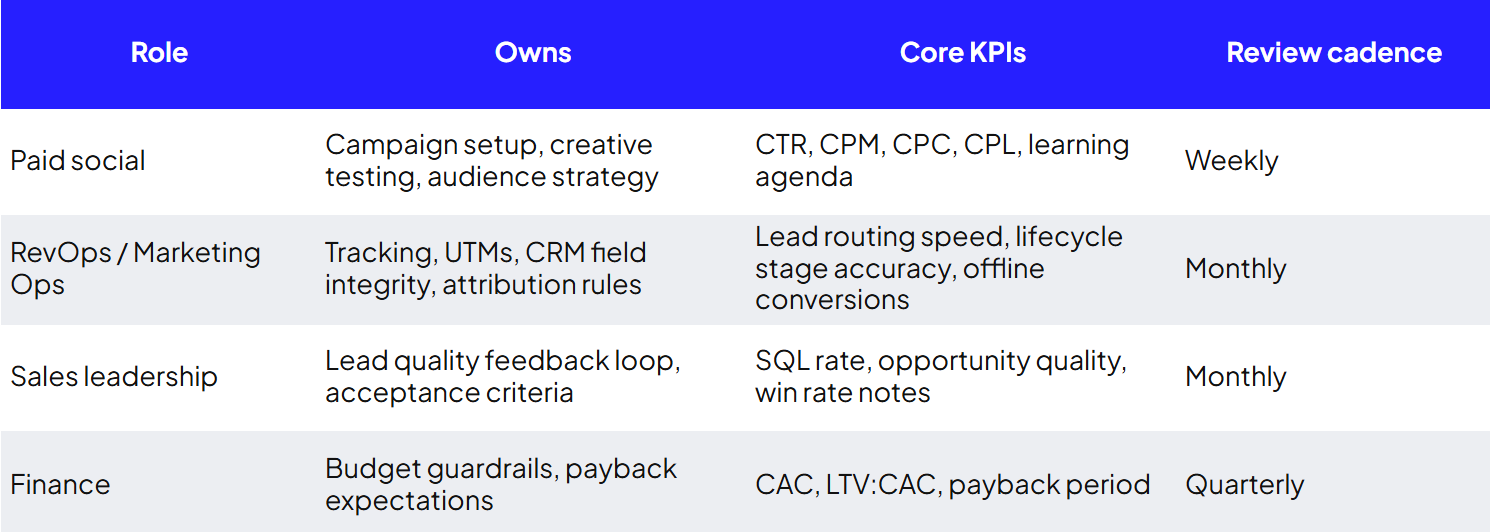


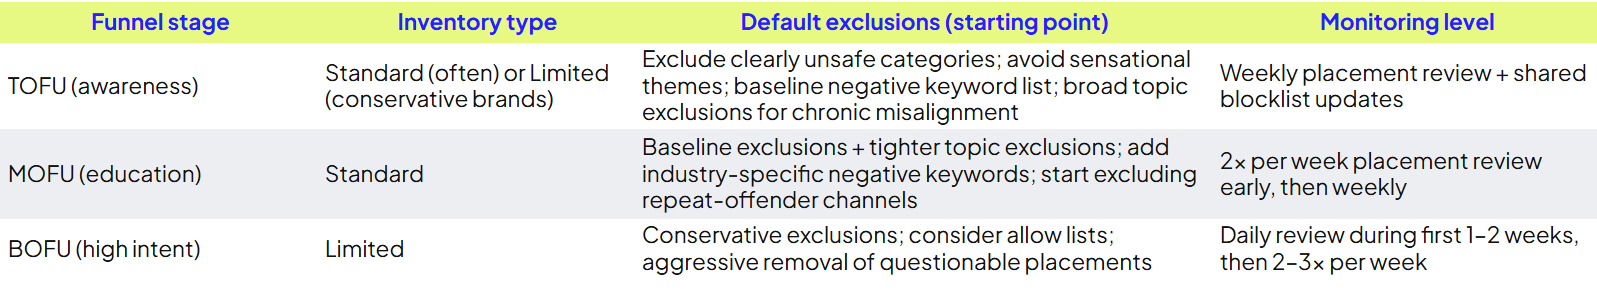
.png)
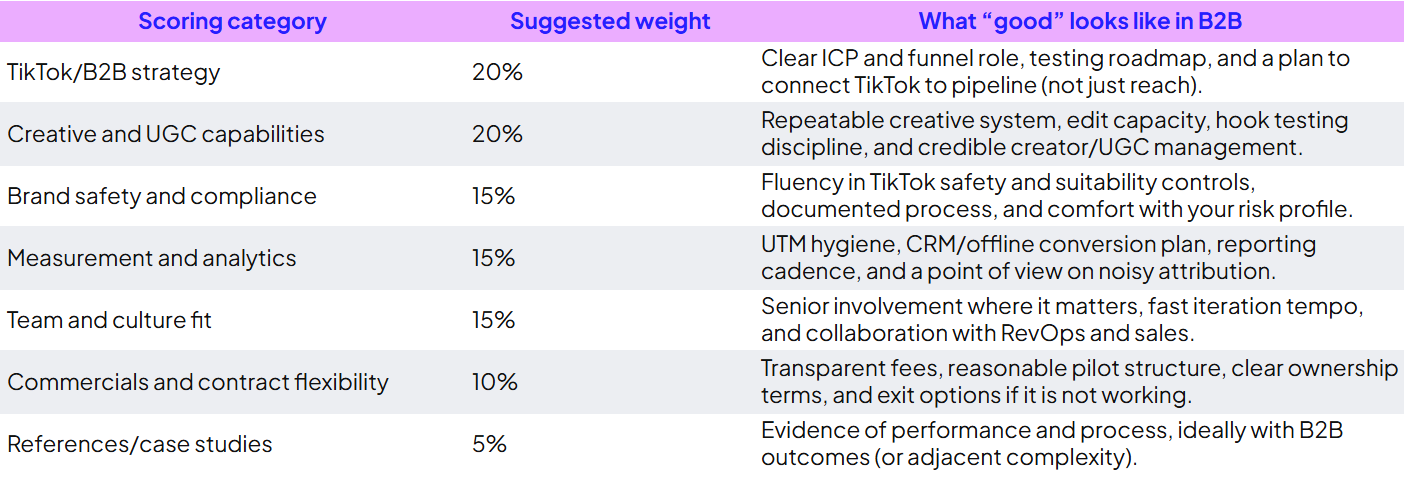
.png)
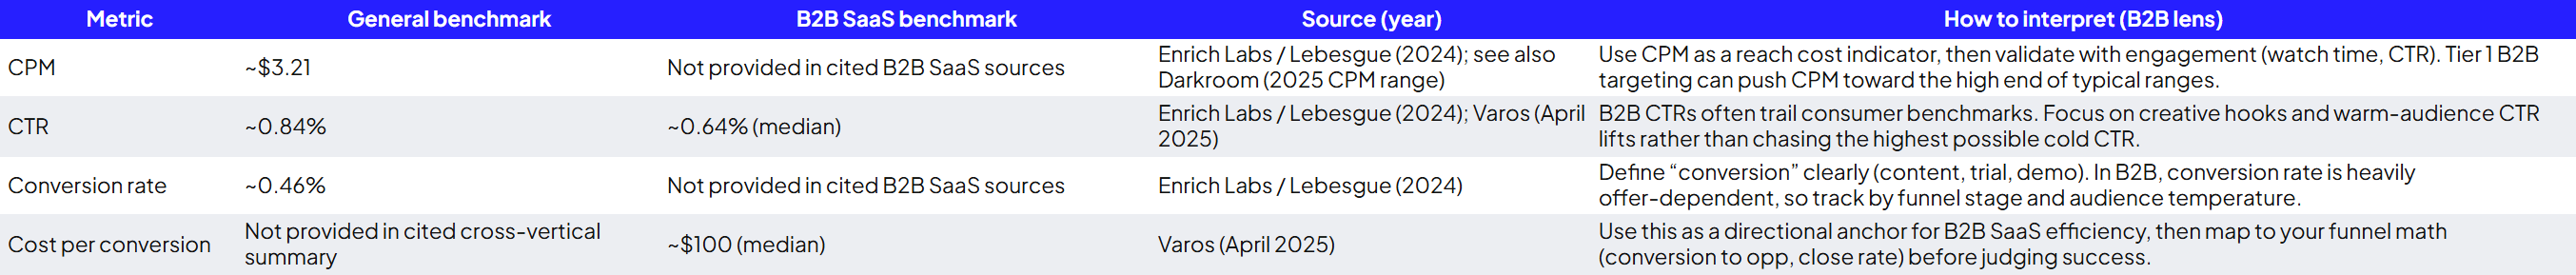
.png)