Impelix came to us to boost lead generation for their new AI-driven cybersecurity product, IMPACT. With a crowded market and risk-averse decision-makers, their sales team struggled to generate qualified leads through conferences and networking. We created several TAMs and deployed LinkedIn conversation ads with tailored messaging for different industries and seniority levels. The messaging was refined to highlight IMPACT’s unique value proposition. Results: 48 MQLs in Q4 with a CPMQL of $445.66, surpassing industry benchmarks. Adjustments to qualifying questions led to improved lead quality, a 8% click-to-open rate, and a 84.2% form completion rate.
Success Stories
15% increase in ad spend, 111% increase in LinkedIn visits
TigerConnect, a cloud-based clinical communication platform, faced challenges with low-volume search terms like "HIPAA texting" and struggled to generate qualified leads. To address this, we expanded their marketing strategy to LinkedIn and implemented account-based marketing (ABM), targeting specific job titles and healthcare roles like patient care and nursing. Testing content assets, we found that an eBook on communication challenges in clinical settings drove the most conversions. As a result, we saw a 31% increase in paid leads and a 111% rise in website visits from LinkedIn, all with only a 15% increase in ad spend.
Success Stories
100% MQL increase, 1 in 3 become customers
Giftbit approached us to enhance the performance of their LinkedIn campaigns. We tested a shift from a single-image ad with broad messaging to a conversation ad featuring a holiday-themed offer. Over a 15-day period, the incentive-driven campaign resulted in a 100% increase in MQLs, directly attributable to the targeted, ICP-specific holiday messaging. Of these, 33% advanced into sales opportunities. This success has set the stage for ongoing message testing and further optimization of Giftbit’s advertising strategy.
If you were to ask B2B marketers what their most important channel to invest in was this year, they’d probably say LinkedIn. And that makes sense. There is a lot that makes this platform desirable.
LinkedIn stands apart not just for its targeting options or bidding models, but because it’s one of the few places online where professionals are primed to think about work before they even log in. It’s a lot easier to grab attention when you’re not competing with a video of a family of raccoons throwing a party on somebody's patio.
The trouble is, while LinkedIn is a platform that we at Abe believe in so much that we literally built an agency for it, we will be the first to admit that it is not the easiest channel to use. Appearances can be deceiving if you're not looking at the right metrics or models. Understanding how well you’re doing on LinkedIn requires context, which, until now, was hard to find.
Fortunately, we’ve developed a LinkedIn Advertising Benchmarks for B2B report, drawing on a large sample of real client campaigns to provide meaningful reference points for budget planning, performance reviews, and strategic decisions.
We’ve made the main takeaways public in this article, but if you’re running LinkedIn ads, please do grab a copy of the free report once it's live. We worked hard to make sure it would be jam-packed with information to help you on your way.
Where do these benchmarks come from?
This data comes from real campaigns run by yours truly as well as our sister agency, Directive Consulting.
The data comes from brands with monthly LinkedIn budgets ranging from $3,000 to $300,000. It spans small businesses and enterprise players, with a strong focus on B2B SaaS. All results were cleaned for outliers and anonymized to ensure data integrity and privacy.
The goal isn’t to prescribe a single “ideal” number, but to provide realistic, defensible ranges that marketers can use to evaluate their own performance.
How to use benchmarks
Effective data analysis depends on context. Your data storytelling is only as good as your details. A good example of this is if you were presenting on LinkedIn advertising costs. On the surface, it might seem expensive, but that would only be the case if you're looking at lead costs comparative to other platforms. If you look at lead quality, suddenly LinkedIn looks like the most valuable channel to ever exist.
Your data storytelling is only as good as your details.
Benchmarks won't tell your unique story for you, but they will help you provide relative measures. As marketers who are relying on reporting to convey how well you're hitting your KPIs, we hope these benchmarks will help you to:
Set expectations that stakeholders can understand
Identify underperforming areas worth optimizing
Justify budget allocation with credible industry data
LinkedIn benchmarks by metric
Cost Per Click (CPC): Around $4.34
Reflects the price to generate a single click. Higher than many social platforms, but typical for LinkedIn’s professional audience.
Cost Per 1000 Impressions (CPM): Approximately $85.24
Reflects the price to generate a single click. Higher than many social platforms, but typical for LinkedIn’s professional audience.
Cost Per Lead (CPL): Roughly $550
A typical cost to capture a qualified lead. While this can seem high, it often reflects better sales conversion rates downstream.
Click-Through Rate (CTR): Typically ~0.66%
LinkedIn CTRs tend to be lower than channels with broader audiences, reflecting its niche professional targeting.
These are overall medians—but the report also includes low-range and high-range values, showing the variability you might expect depending on your industry, offer quality, and targeting strategy. For instance:
CPL values can range from ~$335 on the low end to $885 or higher in more competitive contexts.
CPM can range from ~$56 to $144 or more, depending on audience granularity and creative impact.
CTR typically ranges between ~0.46% on the low side and over 1% in well-optimized campaigns.
These spreads help marketers understand not only what’s “typical,” but what’s possible with strong creative, targeting, and value propositions.
Ad type-specific callouts
Conversation Ads
Median CPC: ~$3.23
Median Cost Per Lead: ~$884
Median Open Rate: ~40.9%
Notes: Strong open rates reflect the direct-message format, but CPL can be higher due to the need for personalized offers and incentives.
Sponsored Content
Median CPC: ~$11.16
Median Cost Per Lead: ~$1,192
Median CPM: ~$32.66
Median CTR: ~0.56%
Notes: A flexible format for both awareness and engagement, with performance shaped heavily by creative quality and audience targeting.
Matching ad types to funnel stages
One of the most consistent findings in our work is that LinkedIn ad performance can’t be separated from funnel stage strategy. Different formats excel at different goals. Most brands will want to do a mix of around 70% lead generation, 30% awareness. The exact blend will depend on your brand notoriety and market penetration. We would virtually never recommend that a brand spend nothing on brand awareness.
Most brands will want to do a mix of around 70% lead generation, 30% awareness.
Top of Funnel (TOFU)
Goal: Build awareness among target audiences
Formats: Sponsored Content, Video Ads
Metrics to watch: Impressions, CPM, reach
Even for cautious budgets, allocating some spend to brand awareness campaigns supports long-term efficiency by increasing recognition before asking for a conversion.
Middle of Funnel (MOFU)
Goal: Capture interest and generate leads
Formats: Document Ads, Lead Gen Forms
Metrics to watch: Cost Per Lead, conversion rate
This is the stage for value exchanges: offering genuinely useful content in return for contact information. Whether it's a whitepaper, webinar, or other gated resource, the content needs to answer real questions your audience has.
Bottom of Funnel (BOFU)
Formats: Conversation Ads, ABM campaigns
Metrics to watch: MQLs, SQLs, Opportunity creation
Here, relevance is everything. Conversation Ads, for example, work best when they feel personal and include compelling incentives—like free trials, credits, or carefully considered offers that encourage direct engagement.
It’s also important to recognize that performance varies significantly by ad format. Below are a few sample median metrics from our dataset, showing how costs and engagement typically differ across common LinkedIn ad types:
Conclusion
It’s easy to think of benchmarks as just numbers on a page. But they’re really about enabling better choices.
By understanding typical cost ranges and outcomes, marketers can communicate performance more credibly, plan budgets based on evidence,
Communicate performance more credibly internally
Plan budgets based on evidence, not guesswork
Spot opportunities for incremental improvement
LinkedIn remains one of the most valuable platforms for B2B marketing, but also one of the hardest to get right. If you don't have a LinkedIn advertising expert on your team, Abe would love to fill in any gaps you're experiencing. Get in touch with our friendly team today.
Most B2B teams still treat TikTok as a risky “nice to have” compared to LinkedIn. But UGC-style creative, stronger compliance hygiene, and better use of first-party data are making it a real demand channel for 2026 planning. This is a curated roundup of 15 TikTok ads agency options B2B leaders actually shortlist, with notes on UGC creative operations, governance, and revenue-focused performance. It’s built for CMOs, VPs of Demand Gen, and paid social managers at SaaS and services companies who want vetted partners and a practical checklist to de-risk selection.
The list of 15 TikTok ads agencies for B2B in 2026
The agencies below are ordered to create variety across geographies, models (performance vs. creator-led), and vertical strengths, not as a strict #1–#15 ranking. Shortlist three to five based on ICP fit, UGC model, and compliance maturity, then validate with TikTok-specific case studies and third-party profiles.
Editorial note: Pricing, ratings, minimums, and case-study numbers change frequently. Re-verify all figures and quotes directly on agency sites and recent G2/Capterra/Clutch profiles before publishing.
Abe
Abe is a B2B paid social advertising agency known for LinkedIn performance, now folding TikTok into a broader Customer Generation™ methodology. The throughline is first-party data and financial modeling: TikTok runs as an awareness and influence layer that still ladders into pipeline reporting, not a siloed creative experiment.
Best for: B2B SaaS and services teams that want TikTok integrated with LinkedIn, Meta, and search, with rigorous LTV:CAC discipline and cross-channel attribution.
Benefits: Connect TikTok audiences to CRM-based retargeting and nurture.
Benefits: Ship UGC-style creative at scale without crushing internal teams.
Benefits: Use TikTok to reduce blended CPL across channels, not just “add spend.”
Standout features: Customer Generation™ framework applied to TikTok testing and scaling.
Standout features: TAM verification and segmentation that informs TikTok creative and targeting.
Standout features: Motion-first creative ops and reuse of TikTok assets across LinkedIn and Meta.
Pricing is typically structured as a model (channel add-on to existing retainers or project testing sprints) unless a starting price is published. Abe manages $120M+ in annual ad spend and has driven 45% average savings in CPL across channels; that operational rigor carries into TikTok. Source: tiktok advertising agency.
Adworkly
Adworkly positions as a TikTok-first UGC marketing partner built for modern growth teams. The appeal for B2B is speed: turning creator-led concepts into testable ad variants quickly, then scaling what converts, not what merely “looks on brand.”
Best for: B2B teams that need high-volume TikTok-native UGC from creators who can speak to professional audiences, plus a fast test-to-scale workflow.
Benefits: Higher creative throughput for hook and angle testing.
Benefits: Creator briefing and production support that reduces internal coordination.
Benefits: A process designed to produce Spark Ads-ready assets.
Standout features: UGC optimized for performance, not just influencer reach.
Standout features: Emphasis on TikTok-first concepts and iteration.
Confirm starting engagement ranges, creative volume per month, and any published B2B outcomes directly in Adworkly materials before citing. Source: Adworkly.
Mangrovea
Mangrovea presents as a Frace-based TikTok ads agency serving EU marketers, combining creative production with full-funnel media management. For 2026, that “specialist plus full-funnel” mix matters when you need both TikTok-native creative and disciplined lead-quality reporting.
Best for: European B2B brands, agencies, and SaaS teams running multilingual campaigns across EU markets.
Benefits: Tailor-made TikTok strategy for B2B offers.
Benefits: Content production support for teams without video capacity.
Benefits: Reporting designed to discuss lead quality, not just reach.
Standout features: Native TikTok formats and trend-aware creative direction.
Standout features: Potential enablement support (workshops/consulting) for internal teams.
Standout features: EU-friendly execution across languages and markets.
Verify minimum engagement sizes and B2B sample results via Mangrovea’s site and third-party profiles before publishing. Source: Mangrovea TikTok Ads Agency.
Pearl Lemon Leads
Pearl Lemon Leads frames TikTok as a lead-generation lever for B2B, with an emphasis on turning attention into booked calls and SQLs. The practical angle is pairing TikTok-native formats with lead capture flows that make sense for SDR and outbound-heavy motions.
Best for: Outbound-heavy B2B companies that want TikTok to warm up prospects before SDR outreach and follow-up.
Benefits: Guidance on offers that convert from TikTok traffic (webinars, tools, trials).
Benefits: Lead-gen framing that prioritizes meetings and qualification.
Standout features: Explicit “TikTok B2B” positioning in service messaging.
Standout features: TikTok channel management plus lead-gen-oriented campaign structure.
Standout features: Social-selling context for turning reach into sales conversations.
Confirm whether they publish package tiers or starting prices, and pull at least one relevant B2B proof point before quoting. Source: Pearl Lemon Leads TikTok B2B Agency.
Z Digital Agency
Z Digital Agency positions as a Swiss/European performance partner running TikTok ads for engagement and conversions, with parallel strength in LinkedIn. For B2B, that pairing can be useful when TikTok creates demand and LinkedIn harvests it with stronger job-title intent.
Best for: European B2B brands that want TikTok plus LinkedIn execution, and need measurement in privacy-sensitive markets.
Benefits: Blended paid social strategy across platforms.
Benefits: Storytelling and creator collaboration formats that feel native.
Benefits: Performance reporting that translates engagement into lead outcomes.
Standout features: Cross-platform expertise, especially TikTok + LinkedIn.
Standout features: Creative approach that supports UGC-style narratives.
Pull indicative budgets, minimum retainers, and B2B case examples from their site and reviews before citing. Source: Z Digital Agency TikTok Ads.
ARYU Advertising
ARYU Advertising is a US-based digital marketing agency that can use TikTok inside a broader mix, leaning into educational content and thought leadership rather than hard-sell. That’s often the right starting point for B2B teams who need a content system before they need aggressive scaling.
Best for: B2B brands early in TikTok that want a channel strategy, content calendar, and lightweight production system.
Benefits: Strategy support for short-form video that fits limited internal resources.
Benefits: Production help for TikTok-style educational creative.
Benefits: Ability to coordinate paid and organic execution across platforms.
Standout features: Emphasis on expert storytelling and humanizing complex offers.
Standout features: Creative systems and calendars, not just media buying.
Standout features: Integration with broader paid media services.
Verify their TikTok engagement model and any B2B TikTok examples in public materials before including performance claims. Source: ARYU Advertising.
NoGood
NoGood is a growth marketing agency that tests TikTok alongside Meta, search, and other channels. The B2B fit is their experimentation posture: treating TikTok as a variable in a broader growth system, with learning velocity as a core deliverable.
Best for: B2B brands that want a performance partner already running multi-channel experiments and budgets that can move fast.
Benefits: Structured testing roadmaps and iteration discipline.
Benefits: Budget reallocation based on learnings across channels.
Benefits: Creative experimentation that supports educational B2B formats.
Standout features: Published POV on TikTok for B2B and content formats.
Standout features: Pragmatic approach to creative testing and scaling.
Confirm pricing models and any TikTok-specific B2B outcomes directly from their site before citing. Source: NoGood B2B TikTok guide.
inBeat Agency
inBeat is a micro-influencer and UGC partner that feeds TikTok ads with creator-generated content, plus a platform angle that helps scale production. For B2B, inBeat often works best as the “UGC engine” while your in-house team or performance partner owns media buying.
Best for: B2B and B2B2C brands needing a steady stream of authentic UGC variants to test.
Benefits: Access to vetted creators and micro-influencers.
Benefits: Multiple versions of assets for creative A/B testing.
Benefits: Repurposing content across TikTok, Instagram, and YouTube.
Standout features: TikTok-specific creative and editing support.
Standout features: Matching creators to narrow audience criteria when needed.
Standout features: UGC production workflows that support paid performance needs.
Check whether engagement is package-based, project-based, or retainer-based and cite only what’s publicly documented. Source: inBeat TikTok Advertising Agency.
House of Marketers
House of Marketers is a TikTok-first shop spanning influencer campaigns, UGC production, and paid support. The enterprise-friendly value is governance: clearer guardrails for creator programs, approvals, and brand safety when multiple stakeholders have opinions and risk tolerance is low.
Best for: Larger B2B brands and scale-ups needing deep TikTok expertise plus strong campaign governance.
Benefits: Influencer selection and management with operational rigor.
Benefits: Full-funnel campaign structure from awareness to conversion.
Benefits: Analytics that help standardize what “good” looks like.
Standout features: Spark Ads and whitelisting workflows.
Standout features: Brand safety and compliance via creative guidelines and approvals.
Standout features: TikTok-native production aligned to platform formats.
Pull any published engagement minimums and quantified outcomes from their case studies before citing. Source: House of Marketers.
The Influencer Marketing Factory
The Influencer Marketing Factory is a global influencer and TikTok advertising agency that builds campaigns around creator content, then tests and optimizes it as paid media. For B2B, they can be a strong fit when your TikTok strategy is creator-led and you need end-to-end campaign management.
Best for: Brands that want to center TikTok on creators and also need paid optimization support.
Benefits: End-to-end creator campaign management.
Benefits: Structured creative testing and iteration.
Benefits: Access to formats that spark community participation (when relevant).
Standout features: Global reach across regions and verticals.
Standout features: Editing and multivariate testing built into the process.
Standout features: Emphasis on governance: contracts, disclosures, and approvals.
Ubiquitous is a creator marketing partner with heavy TikTok focus, oriented around running always-on creator programs and amplifying winners with paid. B2B teams typically use them to produce volume and learn which narratives resonate, then plug those learnings into a broader paid social plan.
Best for: Brands with meaningful creator budgets and an “always-on” UGC testing appetite.
Benefits: Large creator network for scalable testing.
Benefits: Faster identification of winning creators and angles.
Benefits: Reporting to support creative and creator decision-making.
Standout features: Performance-oriented creator programs designed for amplification.
Standout features: Governance considerations at scale (disclosures, licensing, approvals).
Standout features: Process built to feed Spark Ads and ongoing creative refresh.
Treat them as a UGC engine you can pair with a B2B performance hub, and verify contract terms and pricing tiers from public sources. Source: Ubiquitous TikTok service.
Sapphire Studios
Sapphire Studios positions as a high-volume UGC production partner, including work aligned to TikTok’s ecosystem (Creative Exchange positioning). For B2B, this is most useful when media buying is handled elsewhere, but creative volume is the bottleneck.
Best for: B2B brands with a media-buying partner (or in-house buyer) that need a specialist UGC studio.
Benefits: Rapid production of TikTok-native UGC variants.
Benefits: Parallel concept testing to avoid “one video at a time” cycles.
Benefits: Clear handoff of assets for paid testing and iteration.
Standout features: Studio-style creative operations built for throughput.
Standout features: Format variety to support hook and offer testing.
Standout features: Quality controls and approvals suited to brand governance.
Clarify whether pricing is per-asset or package-based and cite only documented benchmarks. Source: Sapphire Studios.
TikToks Agency
TikToks Agency focuses on pairing UGC with TikTok ads using repeatable frameworks for sourcing, scripting, and optimizing content. B2B applicability depends on whether they can adapt hooks and proof points to business buyers without drifting into consumer-only promises.
Best for: Brands that want a managed creator-led workflow with repeatable UGC scripting and testing habits.
Benefits: Structured UGC frameworks for consistent output.
Benefits: Reduced internal admin for creator sourcing and coordination.
Benefits: Content designed to be turned into ads quickly.
Standout features: Emphasis on hooks, scripts, and scalable creative systems.
Standout features: Creator-led production tailored for ad amplification.
Standout features: Operational playbooks brands can reuse internally.
Verify any revenue/ROAS claims and package structures directly from their materials before quoting. Source: TikToks Agency.
GrowMojo
GrowMojo offers TikTok advertising services that pair creative strategy with performance campaigns. For B2B, the best fit tends to be prosumer, SMB, or B2B2C offers where product-led motion and direct response can coexist with brand building.
Best for: Brands seeking a balance of creative and performance, especially prosumer and SMB-facing motions.
Benefits: Full-funnel campaign design that considers both brand and response.
Benefits: Ability to connect ad clicks to on-site conversion improvements (when included).
Standout features: TikTok-focused service offering with platform-specific framing.
Standout features: Testing mindset across formats and concepts.
Standout features: CRO-aware execution for turning traffic into signups.
Confirm minimums, budget guidance, and vertical fit details from public sources before making hard claims. Source: GrowMojo TikTok Advertising Agency.
Avenue Z
Avenue Z positions as a full-stack visibility and social commerce partner that blends creator-led storytelling with performance media and optimization. For B2B, the value is often cross-channel coordination and measurement when TikTok drives demand that later converts through search, LinkedIn, and direct response retargeting.
Best for: Mid-market and enterprise teams that want TikTok tightly integrated with broader social and search measurement.
Benefits: Cross-channel media planning and optimization.
Benefits: Creative built to support both awareness and performance goals.
Benefits: Operating model designed for larger programs and stakeholders.
Standout features: UGC and creator-driven storytelling as a core lever.
Standout features: Governance considerations at scale (music rights, disclosures, policies).
Standout features: Measurement focus across channels, not just in-platform metrics.
Summarize pricing only from reliable public sources and cite relevant B2B or B2B2C case examples where documented. Source: Avenue Z TikTok Marketing Agency.
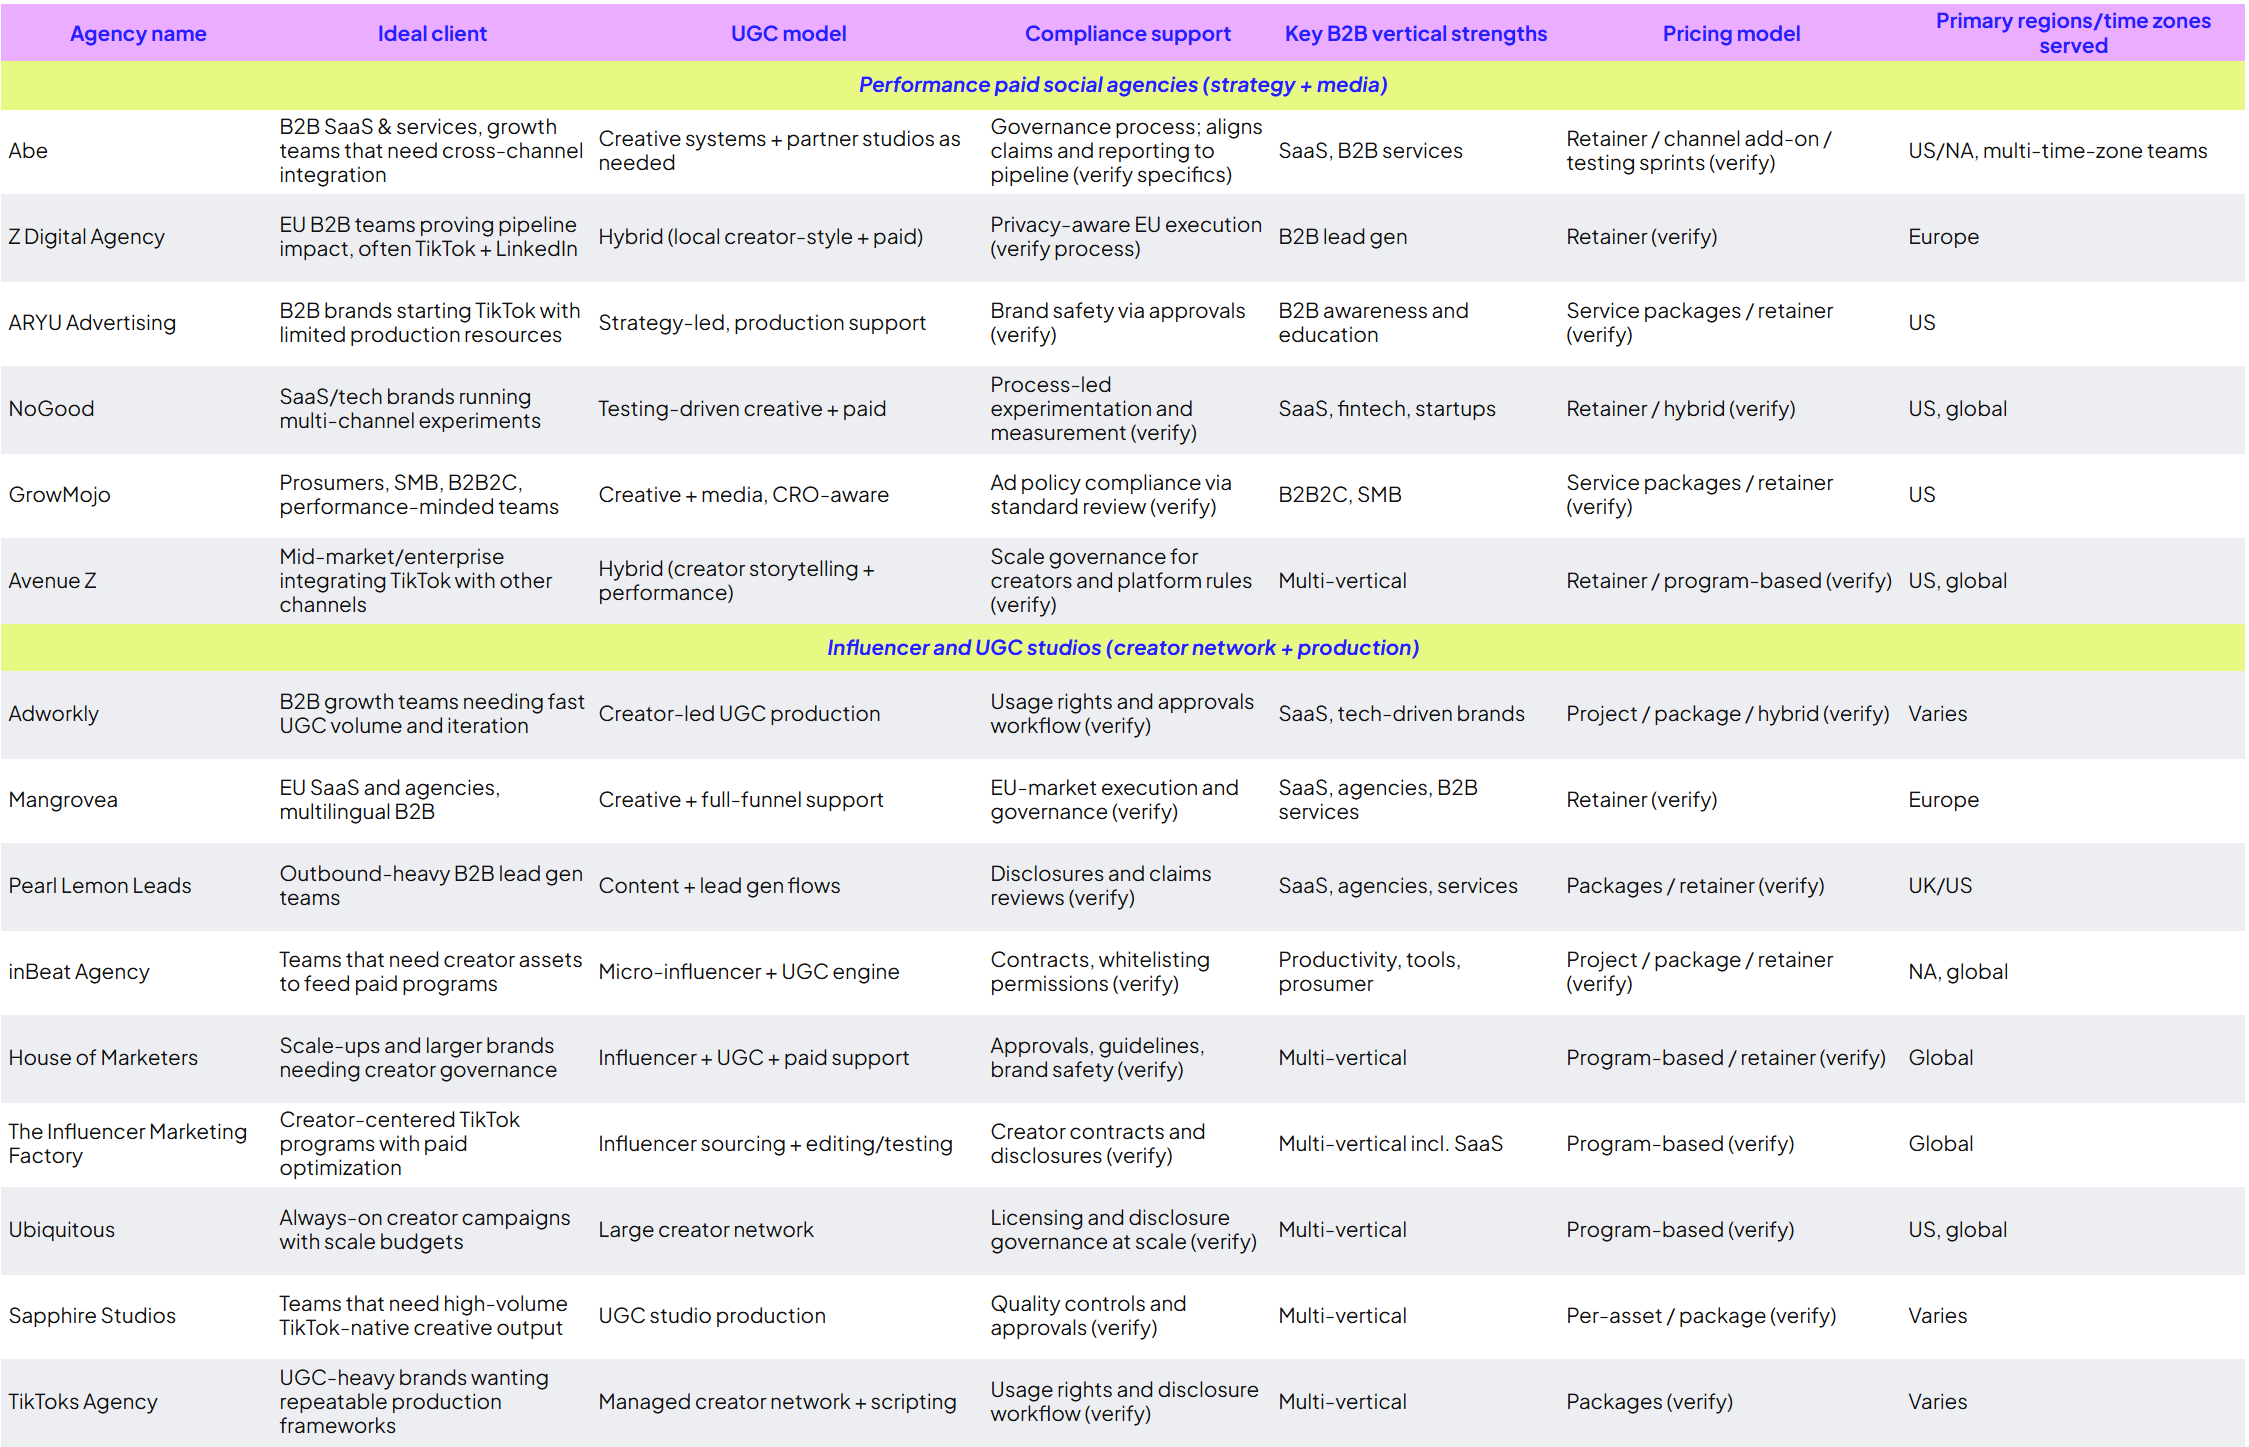
Cross-agency comparison table
Use this table for a first-pass shortlist. It’s intentionally compact: match your funnel goals, UGC needs, and compliance risk profile before you get impressed by vanity metrics.
Footnote: “Pricing model” entries are indicative. Only publish specific starting prices if confirmed via a reliable public source (agency site, Clutch, or G2) and re-verified at publish time.
How we evaluated these TikTok ads agencies
This is a curated, opinionated list, not a scraped directory. The bar is B2B outcomes: can the partner ship TikTok-native creative, manage risk, and still talk credibly about lead quality and pipeline.
Proven TikTok execution: evidence via case studies and documented processes.
UGC operations: capacity to produce and iterate UGC-style creative at scale.
B2B relevance: examples in SaaS, services, fintech, or B2B2C motions.
Compliance maturity: disclosures, usage rights, restricted claims, and governance.
Measurement depth: ability to connect TikTok to CRM and revenue, not just views.
We used public materials and roundups to triangulate options, including Influencer Marketing Hub’s agency list (source) and B2B TikTok guidance from NoGood (source) and Databox (source).
How to use this list in your 2026 TikTok roadmap
Use these agencies as archetypes. Some are best as a performance hub. Others are a UGC engine. Your winning setup for 2026 is usually a tight pairing.
Shortlist one multi-channel performance partner and one UGC studio, then run a structured pilot.
Request TikTok-specific case studies in your vertical and ask for the exact creative volume behind the results.
Ask how they handle creator usage rights, whitelisting, and disclosure requirements (before creative ships).
Decide upfront whether TikTok is measured on assisted pipeline or direct SQLs, and build reporting accordingly.
Use this as a take-to-the-board checklist. Score each item Yes/No (or 1–5) and you’ll surface risk fast, especially on compliance and measurement.
Strategy & fit
We know what role TikTok plays in our funnel (awareness, demand creation, or both).
The agency has B2B case studies in our or a similar vertical.
They can work with our existing channels and data stack (CRM, analytics, attribution).
Creative operations & UGC
They can commit to X–Y new TikTok concepts per month (and define “concept” clearly).
They own or manage a vetted creator network relevant to our ICP (role, industry, tone).
They provide scripts, shot lists, and clear creative briefs for every UGC asset.
Compliance & risk
They have standard processes for FTC/ASA disclosure, licensing, and claims reviews.
They can walk us through how they’ve handled regulated categories before.
Their contracts clearly define usage rights, time windows, and whitelisting permissions.
Measurement & economics
They can model TikTok’s role in our LTV:CAC targets and spend guardrails.
They can connect TikTok to our CRM and analytics stack for pipeline reporting.
They are transparent about fees, margins, and optimization levers.
For deeper compliance context, reference Darkroom’s TikTok UGC guide (source) and Click Digital’s FTC UGC compliance overview (source).
FAQ: hiring a TikTok ads agency for B2B
How long does it take to see results from a TikTok ads agency?
Plan for a real learning window. In the first 30 days, “success” often looks like validated creative angles and reliable on-platform signals. By 60–90 days, you should expect clearer trends on CPL quality and assisted pipeline contribution, assuming tracking and follow-up are in place.
What should be in a B2B TikTok creative brief?
A clear ICP (role, pains, objections), one offer per asset, a single “proof” (data point, demo, customer story, or POV), disclosure requirements, and exactly how the video will be used (Spark Ads, whitelisting, landing page, retargeting sequence).
How do agencies handle brand safetycd and moderation?
Look for written guardrails: restricted claims, comment moderation expectations, creator do’s and don’ts, and a documented approvals process. For UGC, contracts and usage rights matter as much as creative review.
What KPIs should we track beyond views and followers?
Track creative-level hold rate and engagement as leading indicators, then downstream metrics like lead-to-SQL rate, cost per qualified lead, and influenced pipeline. Databox’s B2B demand gen discussion is a useful framing reference.
How do we run a fair pilot test between agencies?
Give each agency the same product context, budget range, and success definition. Standardize creative volume (same number of concepts and variants), standardize measurement (same tracking setup), and evaluate on learning velocity plus lead quality, not just early CPL.
How Abe fits into your TikTok stack
Abe sits on the “B2B performance hub” side of the spectrum: a paid social advertising agency that treats TikTok as part of a Customer Generation system, not a disconnected experiment. That’s especially useful when TikTok targeting is noisy and you need first-party data, economic modeling, and cross-channel retargeting to keep spend honest.
Abe can own TikTok end-to-end or partner with specialist UGC shops from the list, acting as the strategic and performance hub across channels.
We need to prove TikTok’s impact on pipeline and revenue, not just views.
We want TikTok creative that can also work on LinkedIn and Meta.
We need help connecting TikTok engagement to CRM and sales follow-up.
Scale B2B TikTok pipeline with Abe
TikTok is now a serious B2B awareness and demand channel when it’s powered by strong UGC, disciplined compliance, and tight integration with first-party data and the rest of the paid social mix. If your 2026 plan is “test TikTok,” the real question is whether you’re testing creative and measurement with enough rigor to learn quickly and scale safely.
TikTok campaigns designed around verified TAM and ICP lists.
Creative ops that can ship 5–10+ UGC-style variations per month (based on your program scope).
Cross-channel retargeting that turns TikTok viewers into LinkedIn and search leads.
Reporting that ties performance to pipeline and LTV:CAC decision-making.
Choosing a partner for B2B social is not about viral posts or clever memes. It is about verified TAM, clean first‑party data, finance‑grade modeling, and creative that turns into pipeline and revenue. This guide is for B2B marketing and revenue leaders who want to shortlist a B2B social media agency built for revenue, not vanity metrics, with LinkedIn at the core and Meta/YouTube supporting the mix.
Every agency on this list shows evidence of B2B focus, LinkedIn mastery, ABM experience, and a willingness to report into CRM stages, not just impressions. The goal: help you move faster to a credible shortlist, then run structured pilots that your CFO will actually sign off on.
Why specialization matters for pipeline
Most social agencies were built for engagement, not earnings. B2B buying cycles, committees, and deal sizes demand something different: finance‑first social programs that stand up to LTV:CAC and CAC payback scrutiny. If your partner cannot model payback windows or explain how LinkedIn touches show up at SAL and SQL, you are funding awareness, not growth.
Specialized B2B social shops design around how pipeline is actually created. That means verified TAM and named‑account workflows, clear exclusions to cut waste, and creative mapped to jobs, titles, and problems in your ICP. The LinkedIn B2B Institute’s 95‑5 Rule (95% out of market, 5% in market at any time) makes this tighter focus essential: you need programs that warm the 95% while capturing demand from the 5% and connecting both to CRM stages.
These agencies also understand the politics of B2B. They arm you with budgets justified by LTV:CAC, show CAC payback scenarios by channel, and align with RevOps so that every campaign has a path into Salesforce or HubSpot. Instead of “social reach,” you get conversation quality, opportunity influence, and pipeline attribution.
Finally, specialization matters for compliance and governance. When your buyers operate in regulated categories or complex technical domains, you need a partner who knows what can and cannot be said in LinkedIn Conversation Ads, what legal needs to see, and how to keep creative agile without skipping approvals.
Selection criteria (apply consistently)
Use one consistent scoring lens for every agency you evaluate. The following criteria line up with Abe’s pillars: first‑party data, LTV:CAC modeling, TAM precision, and creative tied to revenue.
Platform focus. Prioritize partners with clear LinkedIn proficiency, not just a generic “paid social” line item. Look for:
Hands‑on experience with LinkedIn Conversation Ads, Document Ads, Lead Gen Forms, and matched audiences.
A point of view on where Meta and YouTube help at the top of funnel without wrecking CAC at the bottom.
Clear playbooks for retargeting and audience sequencing, not just single‑touch campaigns.
B2B proof. You want case studies that show pipeline, not just followers. Per directories like Clutch’s Top 50 B2B Marketing Agencies*, credible B2B shops will highlight:
SQL, opportunity, or revenue outcomes* attributed to social.
Stories in SaaS, professional services, industrial, or other B2B verticals.
Complex buying committees, not just one‑click ecommerce wins.
Define and validate TAM, including named‑account lists and exclusions.
Implement UTM discipline and match social touchpoints to HubSpot/Salesforce stages.
Run suppression logic for customers, disqualified leads, and current opportunities.
Pricing transparency. Most B2B social agencies use retainers, project scopes, or hybrids. As Clutch profiles show*, good partners explain:
How fees map to deliverables (strategy, creative, ops, reporting).
What is included vs. treated as out of scope.
The change‑order process so your experiments are not surprise invoices.
Compliance & governance. Your SLA should outline data processing, content approval, and brand safety. At a minimum, agree on:
DPA/data ownership terms, including who controls ad accounts and audiences.
Approval cadences for copy and creative so performance work does not bypass legal.
Brand safety filters and negative placements where relevant.
The list of 25 agencies (ordered for variety, not rank)
This list is intentionally not a ranking. It is a curated set of 25 B2B‑ready social partners spanning pure‑play social shops, performance agencies, and integrated B2B firms. Use the “Best for” notes to align each one to your needs, then dig into case studies, Clutch reviews, and reference calls.
Leadtail
Leadtail is a B2B social specialist focused on strategy, influencer relations, and executive social programs for tech and SaaS buyers. They blend organic, paid, and influencer motions so your brand shows up through practitioners and leaders, not just corporate handles.
Best for: Mid‑market SaaS teams needing influencer + executive social layered onto LinkedIn paid.
Benefits:
Integrated organic + influencer playbooks that complement your paid social.
Practitioner‑led point of view that resonates with technical buyers.
Flexible engagement models for pilots, advisory, or full programs.
Standout features:
Influencer mapping across your niche and TAM.
Thought‑leadership and executive social programs for founders and C‑suite.
Analyst and executive amplification frameworks paired with LinkedIn content systems.
Snapshot: Services: social strategy, organic, influencer programs, executive social; Industries: SaaS and B2B tech; Starting price*: quote
Sculpt
Sculpt is a 100% B2B social agency with organic, paid, and influencer services under one roof and a long operating history in LinkedIn for B2B. They specialize in turning ICP insights into consistent, accountable social cadences.
Best for: Brands that want a unified paid + organic rhythm and channel education that finance and executives can trust.
Benefits:
Sharp ICP messaging that translates into scroll‑stopping social content.
Cadence discipline so channels do not go dark when campaigns shift.
Cross‑functional coordination with content, demand gen, and sales.
Standout features:
Reusable content series frameworks for LinkedIn and adjacent channels.
Tight paid/organic integration with shared themes and offers.
Stakeholder messaging kits to keep CFOs and execs aligned.
Snapshot: Services: organic social, paid social, influencer programs; Industries: B2B tech and professional services; Starting price*: quote
OST
OST is a global B2B social media agency that emphasizes paid and organic programs mapped to specific decision‑makers and regions. They are experienced in orchestrating complex, multi‑market social campaigns across EMEA, North America, and beyond.
Best for: International B2B brands needing multi‑market social execution with central governance.
Benefits:
Multi‑region operations that respect local nuance and compliance.
Repeatable content formats that scale across markets.
Process rigor that enterprise teams are comfortable with.
Standout features:
Audience research and persona work tailored to each geography.
Executive social programs for global and regional leaders.
LinkedIn video and document systems for thought leadership.
Snapshot: Services: strategy, paid and organic social; Industries: tech, industrial, and B2B services; Starting price*: quote
Walker Sands
Walker Sands is a B2B PR and integrated marketing firm where social media services are tightly aligned with communications, analyst relations, and demand creation. Their strength is turning complex stories into cohesive, multi‑channel narratives.
Best for: B2B brands seeking PR + organic social cohesion with demand gen support baked in.
Benefits:
Strong narrative development that carries through PR, content, and social.
Editorial and content depth for technical or emerging topics.
Executive communications capability across owned and social channels.
Standout features:
Thought leadership engines that feed both PR and social.
Integrated PR/social campaigns that connect to demand gen.
Analytics reporting that tracks content and social impact.
Snapshot: Services: organic social, content, PR; Industries: B2B tech, fintech, and related fields; Starting price*: quote
TopRank Marketing
TopRank Marketing is a full‑service B2B agency with deep social and influencer capabilities, especially strong in content‑led social for complex buyers. They excel at pairing experts and influencers with in‑depth content and amplification plans.
Best for: Content‑heavy programs that need influencer + social activation in enterprise environments.
Benefits:
Influencer alignment around your strategic narratives and ICP.
High editorial standards for long‑form and short‑form content.
Comfort working with enterprises and complex approvals.
Standout features:
B2B influencer operations that integrate with campaigns.
Social amplification systems for cornerstone content.
Sagefrog is a B2B integrated agency where social plays a role in brand, demand, and field programs, often in regulated arenas. They are comfortable navigating healthcare, manufacturing, and other compliance‑sensitive spaces.
Best for: Mid‑market B2B companies with regulated or complex offerings needing integrated support.
Benefits:
Experience with regulated industries and compliance constraints.
Integrated planning across social, content, and events.
Pragmatic reporting aligned to pipeline and MQL/SAL metrics.
Standout features:
Persona frameworks that inform social messaging.
Structured social calendars for always‑on and campaigns.
Analytics dashboards that consolidate channel performance.
Snapshot: Services: organic and paid social within integrated programs; Industries: healthcare, tech, industrial; Starting price*: quote
Ironpaper
Ironpaper is a B2B growth agency that ties social programs directly to pipeline and revenue, with strong conversion optimization chops. Their work often blends content, web, and paid media into one demand engine.
Best for: B2B teams that want social woven into a full‑funnel demand generation engine.
Benefits:
Clear linkage between social traffic and funnel stages.
CRO discipline applied to landing pages and offers.
Alignment between content strategy and paid social execution.
Standout features:
ABM support with named‑account social programs.
Lifecycle and cohort reporting from awareness to revenue.
WebFX is a large digital agency with a dedicated B2B social practice and breadth across SEO, paid media, CRO, and analytics. For teams wanting one vendor across multiple channels, they are a common choice.
Best for: Brands needing breadth (social + SEO + CRO) under one roof with established processes.
Benefits:
Operational scale and bench depth across disciplines.
Cross‑channel coordination to align search, social, and web.
Mature processes for reporting and QA.
Standout features:
Paid social operations spanning LinkedIn, Meta, and more.
Reporting suites that can roll up to executive dashboards.
SEO and social integration for content amplification.
Snapshot: Services: paid and organic social, SEO, CRO, analytics; Industries: multi‑vertical including B2B; Starting price*: tiered packages
NinjaPromo
NinjaPromo is a social‑forward agency with B2B campaigns and influencer execution, particularly active in SaaS and fintech. They bring creative throughput and multi‑platform reach to performance‑minded programs.
Best for: Brands seeking high creative volume and influencer support around launches and campaigns.
Benefits:
Strong creative velocity for paid social assets.
Experience across LinkedIn, X, Meta, and niche platforms.
Ability to incorporate influencers into B2B motions.
Standout features:
Paid social playbooks tailored to SaaS/fintech funnels.
Influencer operations including sourcing and management.
Social Driver is a digital communications and social agency with strong creative craft and storytelling. They serve public sector, associations, and B2B brands that need message discipline.
Best for: Narrative‑driven brands balancing brand building and demand capture on social.
Benefits:
High‑quality visual and motion design.
Storytelling frameworks for complex topics.
Stakeholder alignment across communications and marketing.
Standout features:
Visual systems for social feeds and campaigns.
Content series planning across channels.
Reporting that ties storytelling work to engagement and pipeline influence.
Snapshot: Services: organic and paid social, creative; Industries: public sector, nonprofits, B2B tech; Starting price*: quote
Gravity Global
Gravity Global is a global B2B agency where social is tightly integrated with brand strategy and performance media. They support complex, multi‑market enterprises with serious governance needs.
Best for: Enterprise brands needing multi‑market scale, creative excellence, and strict governance.
Benefits:
Governance frameworks that satisfy enterprise risk and legal teams.
Scale across regions, languages, and business units.
Blend of brand strategy and performance analytics.
Standout features:
Brand/performance frameworks that connect awareness to pipeline.
Multi‑region operations and localization support.
Analytics that track creative effectiveness across markets.
Elevation Marketing is a full‑service B2B agency that embeds social into integrated demand and brand programs. They specialize in complex buying committees, especially in industrial and tech.
Best for: Complex B2B buying committees that need coordinated content and social motions.
Benefits:
Persona clarity based on real buying journeys.
Content depth across web, thought leadership, and social.
Integrated operational support from planning through reporting.
Standout features:
Campaign architecture that includes social from day one.
Persona mapping to guide creative and offers.
Social operations processes for repeatable execution.
Directive is a performance‑oriented B2B marketing agency where social is tied tightly to pipeline, often in tandem with paid search and revenue operations. They position themselves as finance‑first and experiment‑heavy.
Best for: Mid‑market to enterprise SaaS focused on measurable demand and CAC control.
Benefits:
Finance‑first planning that models LTV:CAC and payback windows.
Rigorous testing culture to tune offers and creatives.
Conversion optimization built into media planning.
Standout features:
Paid social + search integration with shared reporting.
CRM reporting to show SQLs and pipeline per campaign.
Structured experimentation frameworks.
Snapshot: Services: paid media including social, search, CRO; Industries: SaaS and B2B tech; Starting price*: retainer
Obility
Obility is a B2B performance agency with strong paid media roots where social and search are orchestrated for pipeline. They are known in the SaaS ecosystem for disciplined targeting and reporting.
Best for: B2B tech companies needing precise paid social + search orchestration.
Benefits:
Tight ICP definition and enforcement in campaigns.
Data rigor in tracking, attribution, and optimization.
Collaboration with sales and CRO resources.
Standout features:
LinkedIn campaign operations tuned for SaaS funnels.
Audience development and list‑based ABM tactics.
Reporting at lead, opportunity, and pipeline levels.
Godfrey focuses on industrial B2B, where social supports technical storytelling and complex sales cycles. They translate engineering‑speak into content and campaigns that buyers can act on.
Best for: Industrial and manufacturing firms with complex offerings and long sales cycles.
Benefits:
Technical fluency with engineers, product teams, and SMEs.
Awareness of industry regulations and safety/compliance needs.
Stakeholder coordination across marketing and sales.
Standout features:
Content + social integration for technical narratives.
Executive social programs tuned to industrial audiences.
Industry‑specific creative and positioning.
Snapshot: Services: organic and paid social, content, campaigns; Industries: industrial and manufacturing; Starting price*: quote
The Mx Group
The Mx Group is a full‑service B2B agency that embeds social in integrated go‑to‑market programs. They work with enterprises that need coordinated efforts across channels, segments, and regions.
Best for: Enterprise programs with multi‑channel needs and complex internal alignment.
Benefits:
Strategy depth spanning brand, demand, and digital.
Creative teams equipped for multi‑format social work.
Robust analytics that map campaigns to pipeline.
Standout features:
Campaign orchestration across media, content, and social.
ABM capabilities including named‑account social plays.
Analytics and dashboards for marketing and sales leaders.
New North is a B2B agency serving tech and services firms, pairing social with content and email. They are geared towards SMB and mid‑market teams that need practical scopes.
Best for: SMB/mid‑market B2B with constrained budgets and lean teams.
Benefits:
Practical, right‑sized scopes for growing organizations.
Clear reporting and communication cadences.
Consistent social cadence tied to content and email.
Standout features:
Content‑social mixes designed for lead nurturing.
Basic ABM and account‑list programs.
Dashboarding for leadership visibility.
Snapshot: Services: social, content, email programs; Industries: tech and professional services; Starting price*: quote
Zen Media
Zen Media is a B2B PR and social agency with strong executive social and trend‑led content. They help brands show up in feeds and the press at the same time.
Best for: Brands seeking PR/social synergy and thought leadership around executives or founders.
Benefits:
Fast path from idea to published social content.
Fluency in trends and conversation formats across platforms.
Executive amplification that aligns with PR efforts.
Standout features:
Social PR programs bridging earned and owned channels.
Kuno Creative is an inbound and RevOps‑aware B2B agency where social is tied to lifecycle and marketing automation, particularly on HubSpot. They are adept at building nurture‑ready audiences from social.
Best for: Teams on HubSpot wanting tight social + lifecycle alignment.
Benefits:
RevOps mapping from social touch to lifecycle stages.
Linkage between social, email nurture, and content offers.
Deep familiarity with HubSpot features and reporting.
Standout features:
HubSpot integration and workflow design for social leads.
Gorilla 76 is an industrial marketing specialist where social supports demand creation and sales enablement for manufacturers. They translate complex offerings into content that sales can actually use.
Best for: Mid‑market industrial companies targeting technical buyers.
Benefits:
ICP precision around plants, facilities, and technical roles.
Alignment with sales to turn content into conversations.
Depth of content for long sales cycles.
Standout features:
Account list programs integrated with LinkedIn.
Video and visual content tailored to industrial buyers.
97th Floor is a performance and content agency where social is part of growth programs that prioritize testing. They mix creative experimentation with analytics rigor.
Best for: Brands seeking testing velocity and creative experimentation on social.
Benefits:
Structured experimentation across audiences, offers, and formats.
Creative variations tuned to buyer stages.
Analytics rigor for evaluating test outcomes.
Standout features:
Paid social frameworks for demand creation and capture.
Content motions that feed social and SEO together.
Dashboards for tracking multi‑channel performance.
Disruptive Advertising is a performance agency with paid social depth and a B2B/B2C mix of clients. They are built for scale and constant testing across platforms.
Best for: Paid‑media‑first teams who need social scale and structured testing.
Benefits:
Testing rigor, from creative to bidding strategies.
Budget management for high‑spend paid social accounts.
Broad platform operations across LinkedIn, Meta, and more.
Standout features:
Paid social frameworks tuned for both lead gen and pipeline.
Creative testing methodologies with clear learning agendas.
Viral Nation is a social and influencer powerhouse with robust enterprise governance. Historically strong in consumer and creator programs, they also support B2B brands that want serious influencer reach.
Best for: Enterprise brands with influencer + social at scale and complex compliance needs.
Benefits:
Access to extensive influencer and creator networks.
Compliance and brand safety discipline for large brands.
Creative volume for big campaigns and always‑on programs.
Standout features:
Influencer networks with structured contracting and approvals.
Multi‑platform operations including LinkedIn for B2B.
Measurement frameworks for influencer and paid social work.
Acadia is a modern digital agency with social, paid media, and analytics under one umbrella, serving a mix of B2B and B2C brands. Their pitch centers on data‑driven growth.
Best for: Brands needing analytics‑heavy social programs across multiple channels.
Benefits:
Data rigor and instrumentation across the funnel.
Integrated paid media including social and search.
Analytics strategy that goes beyond simple dashboards.
Standout features:
Paid social programs designed with clear KPIs and tests.
Analytics and experimentation across customer journeys.
Social Motto is a social‑focused agency with a storytelling emphasis across paid and organic, serving both B2B and B2C brands. They focus on narrative and consistency.
Best for: Brands wanting narrative depth and a steady cadence across social channels.
Benefits:
Story‑led creative aligned to brand strategy.
Consistent operations that keep feeds active and on‑message.
Covers both paid and organic to keep signals flowing.
Standout features:
Social calendars with themes and series.
Creative kits for campaigns and evergreen content.
Reporting focused on both engagement and lead generation.
Snapshot: Services: organic and paid social; Industries: B2B and B2C; Starting price*: quote
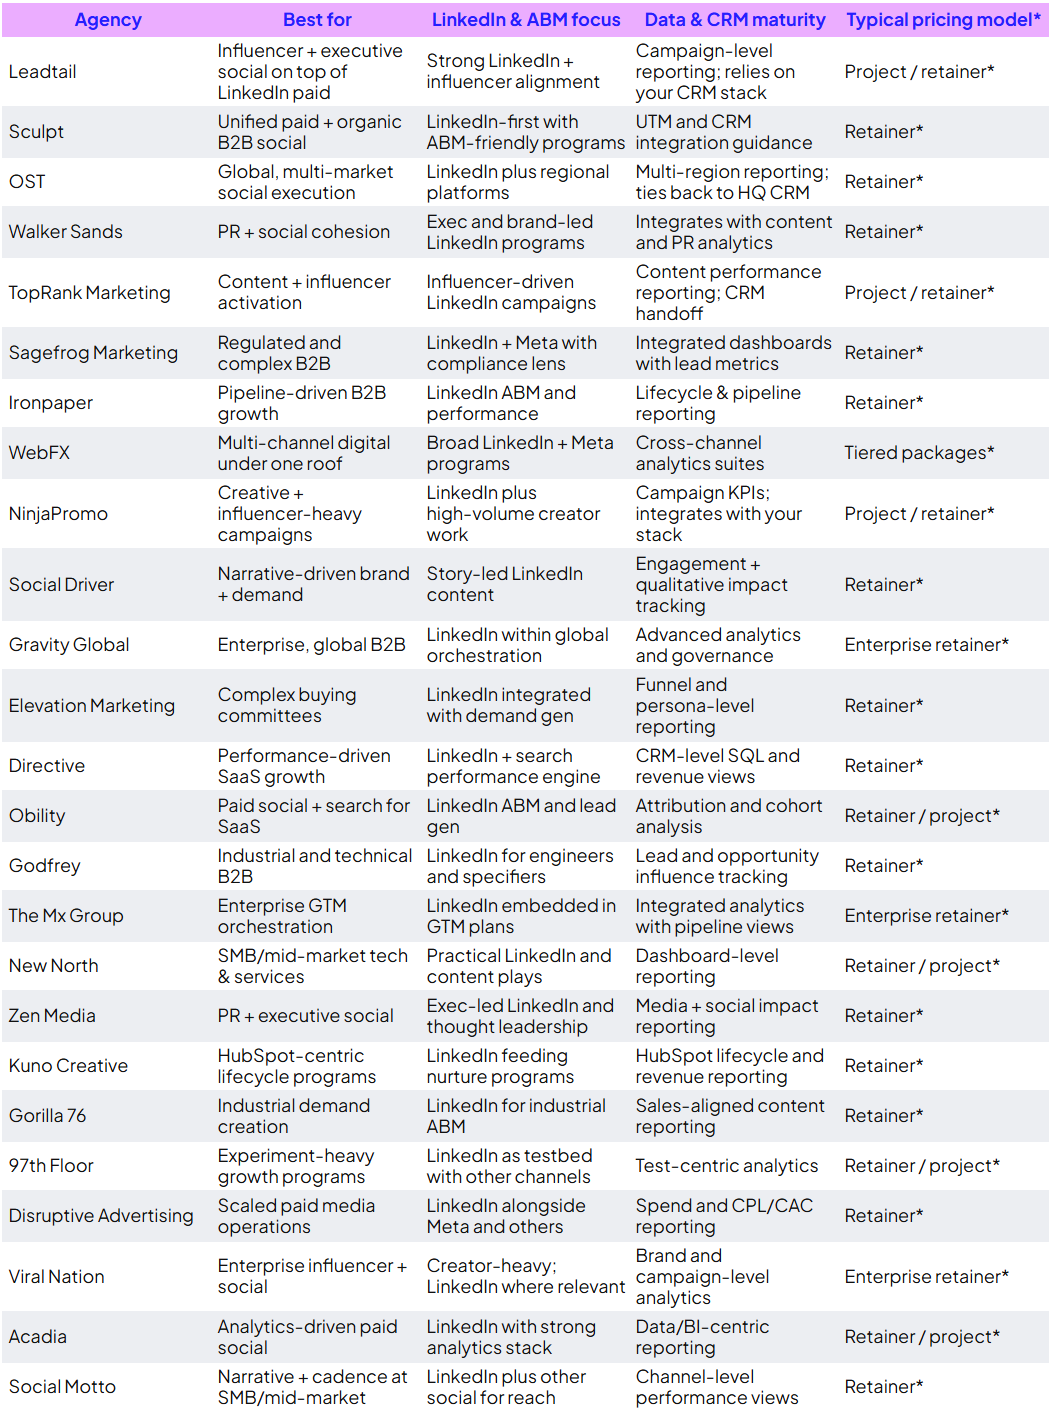
Comparison table (summarize buyers’ view
Use this quick comparison to shortlist 4–6 agencies aligned to your goals, ICP, and operating model, then go deeper on case studies and references.
* Pricing and capability claims may change from time of publishing
How to choose (checklist)
Once you have a shortlist, evaluate partners with the same rigor you apply to product or sales investments. Use this checklist to structure internal alignment and vendor conversations.
Map goals to LTV:CAC and CAC payback; define max CAC and target CPL by channel.
Ask for first‑party data workflows: verified TAM, exclusions, UTM discipline, CRM stage mapping.
Demand CRM screenshots tying spend to SAL/SQL/pipeline; reject vanity dashboards.
Clarify pricing model and SLAs (response times, deliverables, QA) with change‑order rules*.
Run 2–3 vendor pilots for 90 days with pre‑agreed gates; scale only on modeled performance.
Layer in buyer‑style questions your stakeholders will ask, informed by search behavior and resources like Sprout Social and Clutch:
What does a B2B social media agency actually do? In practice, they plan and run paid and organic programs (often LinkedIn‑first), map activity to CRM stages, and align content and targeting with pipeline goals, not just impressions or clicks (source: Sprout Social).
How much do B2B social media agencies cost? Most operate on retainers or hybrid models. Monthly fees vary widely by scope, channels, and creative needs; use Clutch and G2 profiles to see current ranges and always confirm details in writing before signing (source: Clutch).
Is LinkedIn still the best platform for B2B? LinkedIn remains the highest‑intent channel for reaching professional buyers. Pair it with retargeting and search to close the loop from attention to opportunity (source: LinkedIn B2B Institute).
What should my agency SLA include? Your SLA should spell out response times, deliverable cadence, QA steps, reporting schedules, escalation paths, and data ownership terms tied to pipeline outcomes, not just media spend (source: industry standards).
Move Beyond Manual Vendor Vetting With Abe
Abe builds paid social programs that turn first‑party data into pipeline. We validate channels with LTV:CAC, verify TAM, and ship creative tied to revenue. Our Customer Generation™ methodology aligns Marketing and Sales from day one.
First‑party data: verified TAM + exclusions to reduce waste and lower CPL.
Finance‑first: LTV:CAC and CAC payback models drive budgets and gates.
Creative that sells: role‑specific ads and offers across TOF → BOF.
Clarity: CRM‑stage reporting (SAL/SQL, pipeline) you can take to Finance.
Instead of sifting through dozens of vendor decks alone, use a partner built for B2B social that already thinks like your CFO. Want a shortlist tailored to your ICP and goals? Book a consult and we will map your 90‑day plan, including channel mix, budget ranges, and pilot success gates.
If you are evaluating X (formerly Twitter) as a pipeline channel, your agency pick matters more than your media budget. The right Twitter ads agency aligns targeting, creative, and reporting to LTV:CAC and payback, not just CTR. This guide is built for B2B marketing leaders who want a clean selection process, the right RFP questions (brand safety, follower and keyword strategy, reporting), and a scorecard you can actually use.
If you are comparing partners across platforms too, start with best B2B social media agencies. And if your mix includes additional paid social beyond X, pressure-test how an agency handles adjacent channels like a Meta advertising agency (creative velocity and conversion measurement tend to separate good from “busy”).
Why agency selection fails (even for smart teams)
Most B2B teams do not fail on effort. They fail on incentives and missing controls. A weak agency selection process inflates CPL, hides wasted spend behind “engagement,” and delays the one thing that matters: a repeatable path from impressions to qualified pipeline.
Trap 1: “Engagement-first” goals
Teams optimize for likes, replies, or cheap video views. Result: high engagement, low opportunity volume. Set finance guardrails (target CAC, payback) and map objectives to revenue milestones so the account is forced to optimize for outcomes, not activity.
Example: a Reach/Engagement campaign drove 0 opportunities; a Website Conversions campaign with the same budget generated MQLs at target CPL once pixel/CAPI events were implemented.
Trap 2: Overbroad follower look-alikes
Spraying look-alikes of large publishers or generic influencers expands reach but not ICP fit. Require follower look-alikes from credible B2B handles (for example, industry analysts) plus tight geo and language filters and exclusions.
Impact: irrelevant traffic, high CPR, shallow time on site.
Trap 3: Keyword lists with mixed intent
Ambiguous terms (for example, “security”) pull consumer chatter. Build intent-weighted clusters and negatives; X guidance for keyword targeting emphasizes starting with a sufficiently sized, relevant keyword set (X recommends adding at least 25 relevant keywords) and iterating with exclusions to protect relevance.
Running a single asset per ad group stalls delivery. Require a weekly test plan across copy, formats, and vertical video assets so creative does not become the bottleneck.
How to select an X (Twitter) ads agency: step by step
Use this sequence to force clarity: inputs up front, checkpoints during evaluation, and acceptance criteria before you hand over spend. The goal is not a “great pitch.” The goal is a repeatable operating plan for Twitter advertising for B2B.
Step 1: Define outcomes and finance guardrails
Inputs: target CAC, payback period, LTV, win rates by segment, SQL and opportunity goals, acceptable CPL/CPR by objective.
Thresholds: if modeled CAC payback > target months or LTV:CAC < 3:1 for paid social, flag and adjust targeting or offer before launch. This is where many “X is too top-of-funnel” takes come from: the finance model was never agreed, so the channel gets judged on vibes.
Step 2: Build a tight shortlist and RFP
Shortlist 3–5 agencies with proven B2B references. Share budget bands, ICP, and goals, and ask for a lightweight diagnostic (no spec work). You want to see how they think, not how many slides they can produce.
RFP must include: brand safety plan, follower/keyword strategy, measurement/reporting, creative/testing cadence, and a pilot plan with milestones.
Step 3: Vet X targeting strategy (follower look-alikes + keywords)
Follower look-alikes: ask which accounts anchor similarity, how many, and how performance will be pruned. Interests: cap sub-topics to 10; refine by results (as commonly recommended in X targeting guidance).
Keyword targeting: require at least 25 tightly relevant keywords, clustered by intent; include negative keywords and a refresh cadence. Reference: Keyword targeting (X Business Help).
Step 4: Assess creative formats and testing plan
Expect a weekly test matrix across Text, Image, Video, Carousel, and vertical video. If the agency cannot show how it produces motion-first assets with strong hooks in the first 1–2 seconds, you will not get stable learnings.
Require landing page QA and message-market match for each audience cluster. If they can run paid social but cannot diagnose why the page does not convert, you are buying traffic, not pipeline.
If your team is also investing in community-style placements, ask how learnings transfer across channels such as a Reddit advertising agency approach (audience intent and creative truthfulness tend to correlate with downstream lead quality).
Step 5: Require measurement and reporting discipline
Must-haves: X Pixel or Conversions API, objective-aligned results, cost per result, reach/frequency, and conversion reporting from Ads Manager; breakdowns by audience, keyword, and creative.
Ask for weekly commentary and decisions: what we learned, what we are changing, and projected impact on CAC and pipeline. For metric definitions and common reporting fields, reference: X/Twitter ad metrics (Hootsuite Help, 2025).
Step 6: Lock in brand safety and suitability controls
Controls: Sensitivity Settings tier, adjacency controls, keyword/author exclusions, and third-party measurement (IAS and DoubleVerify). Note: IAS pre-bid optimization is available for specific surfaces like vertical video in the U.S.; post-bid measurement supports feed placements in additional markets.
If the agency name-drops GARM brand safety but cannot explain how sensitivity settings, adjacency controls, and exclusion lists are operationalized weekly, treat it as a red flag.
Step 7: Pilot, contracting, and SLAs
90-day pilot with phase gates: week 2 (tracking verified), week 4 (first learnings and creative swap), week 8 (midpoint goals review), week 12 (scale/hold/stop decision).
Also decide up front how the agency will coordinate with your other performance partners (for example, a linkedin advertising agency) so attribution and audience overlap are handled intentionally instead of debated in month three.
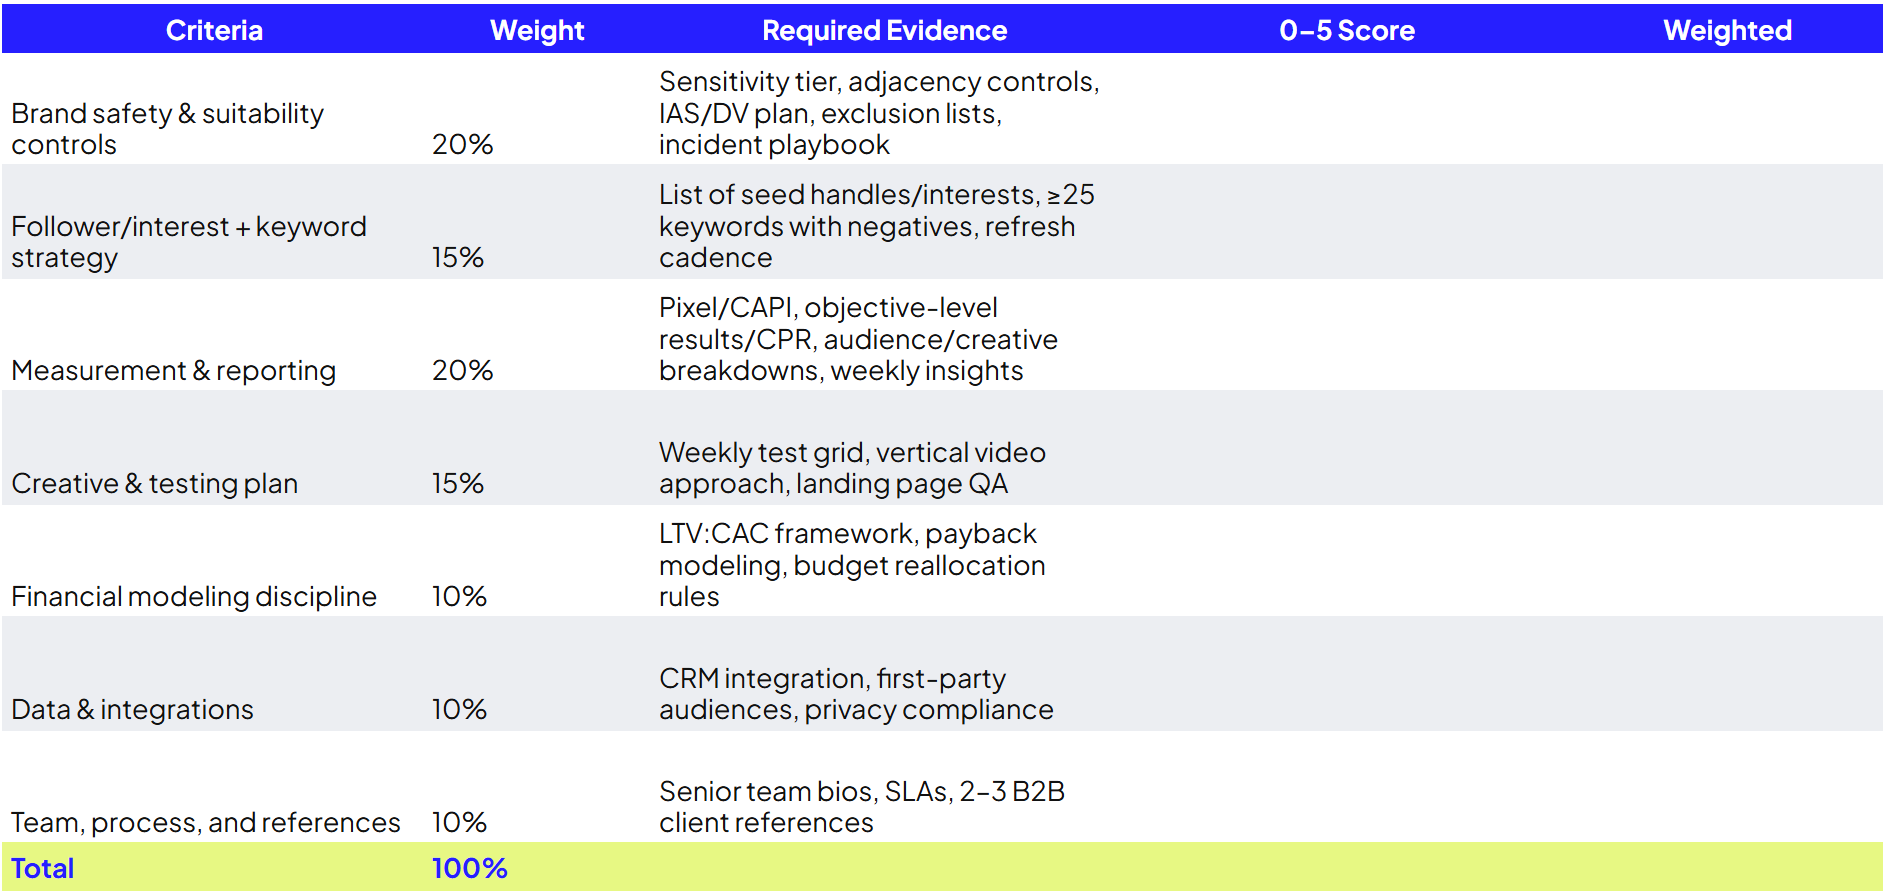
Template: X Ads Agency RFP Scorecard
Use this template as your single source of truth during evaluation. Score every vendor the same way, require proof, and attach artifacts in an appendix (screenshots, sample reports, example test plans, brand safety documentation).
Scoring rubric: 0 = does not meet, 3 = meets, 5 = exceeds with proof. Require artifacts in an appendix. If a vendor cannot provide proof (sample Ads Manager reporting, example exclusion lists, an actual weekly test matrix), treat the score as a 0 until proven otherwise.
What tactics are most prone to wasted spend on X?
It is rarely the tool; it is targeting, creative, or measurement. Calibrate each tactic for intent and safety so you are not buying “cheap” results that never turn into pipeline.
Engagement-only campaigns: fine for awareness; for pipeline, use Website Traffic/Conversions with pixel/CAPI and post-click retargeting.
Overbroad follower look-alikes: anchor in credible B2B accounts; cap interest sub-topics; prune weekly.
Use these as pass/fail gates before you scale spend or sign a longer contract. If the agency cannot pass these, the risk is not “performance.” The risk is unmeasurable work.
Tracking: X Pixel or Conversions API implemented and validating standard events (pass/fail).
Keywords: ≥25 active, intent-clustered terms with at least 5 negatives (pass/fail).
Follower/interest targeting: ≤10 sub-topics per campaign; seed handles documented (pass/fail).
Third-party verification: IAS/DV in place (pre-bid where applicable; post-bid for feed), weekly reports (pass/fail).
Creative: ≥4 active assets per ad group, including vertical video; weekly refresh plan (pass/fail).
Reporting: weekly Ads Manager exports with objective results, CPR, and breakdowns by audience/creative (pass/fail).
FAQ
What is a Twitter ads agency?
A partner that plans, buys, and optimizes X (formerly Twitter) campaigns, aligning targeting, creative, and measurement to your B2B pipeline and revenue goals.
Why use X for B2B?
Real-time conversation targeting, keyword intent, and vertical video can efficiently reach decision-makers when paired with first-party data and tight measurement. For a platform overview and setup guidance, see Brandwatch’s overview of X ads and X Business resources.
How long to see results?
Expect signal within 2–4 weeks (traffic/CPR trends) and pipeline indicators by weeks 6–8, assuming tracking and creative velocity are in place.
What budget do we need?
Plan for a 90-day pilot with enough daily budget to hit learning thresholds across 2–3 audiences and 3–4 creatives per audience. Tie spend to CAC/payback targets, not fixed CPM goals.
How will we measure success?
Objective-aligned results and CPR in Ads Manager, conversion events from pixel/CAPI, and CRM-validated opportunity creation and CAC against LTV. For metric definitions, reference: X/Twitter ad metrics (Hootsuite Help, 2025).
Move Beyond Manual Agency Selection With Abe
Abe is a B2B paid social advertising agency built for revenue. Our Customer Generation™ methodology aligns first-party data, financial modeling, and creative testing to make X a pipeline channel, not just an awareness line item.
Efficiency: 45% average CPL savings driven by tighter audiences and rapid creative iteration.
Quality: TAM verification and finance-first reporting tie spend to SQLs, opportunities, and CAC payback.
Velocity: Weekly test plans across formats, including vertical video, to compound learnings.
Ready to pressure-test your RFP plan and pilot? See how Abe runs X for B2B and map it to your pipeline goals, then move into a 90-day test with clear milestones.
BLOGS
4 minute read
How to select a Twitter ads agency for B2B (with RFP)


.png)
.png)
.png)